

Detecting changes in retinal function: Analysis with Non-Stationary Weibull Error Regression and Spatial enhancement (ANSWERS)
- PMID: 24465636
- PMCID: PMC3894992
- DOI: 10.1371/journal.pone.0085654
Detecting changes in retinal function: Analysis with Non-Stationary Weibull Error Regression and Spatial enhancement (ANSWERS)
Abstract
Visual fields measured with standard automated perimetry are a benchmark test for determining retinal function in ocular pathologies such as glaucoma. Their monitoring over time is crucial in detecting change in disease course and, therefore, in prompting clinical intervention and defining endpoints in clinical trials of new therapies. However, conventional change detection methods do not take into account non-stationary measurement variability or spatial correlation present in these measures. An inferential statistical model, denoted 'Analysis with Non-Stationary Weibull Error Regression and Spatial enhancement' (ANSWERS), was proposed. In contrast to commonly used ordinary linear regression models, which assume normally distributed errors, ANSWERS incorporates non-stationary variability modelled as a mixture of Weibull distributions. Spatial correlation of measurements was also included into the model using a Bayesian framework. It was evaluated using a large dataset of visual field measurements acquired from electronic health records, and was compared with other widely used methods for detecting deterioration in retinal function. ANSWERS was able to detect deterioration significantly earlier than conventional methods, at matched false positive rates. Statistical sensitivity in detecting deterioration was also significantly better, especially in short time series. Furthermore, the spatial correlation utilised in ANSWERS was shown to improve the ability to detect deterioration, compared to equivalent models without spatial correlation, especially in short follow-up series. ANSWERS is a new efficient method for detecting changes in retinal function. It allows for better detection of change, more efficient endpoints and can potentially shorten the time in clinical trials for new therapies.
Conflict of interest statement
Figures
 where
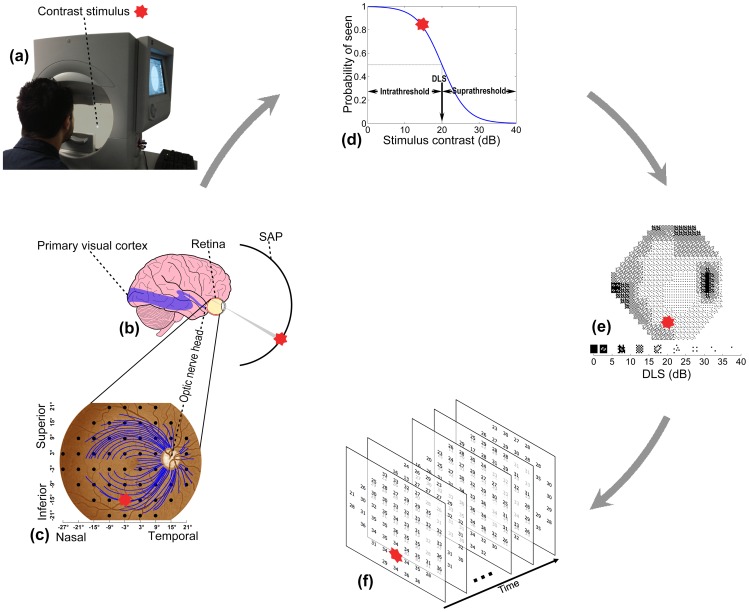
where  is the luminance of the stimulus in apostilbs and 31.6 apostilbs is the background luminance. The DLS ranges between 0 dB (high contrast stimulus, blindness) and around 35 dB (low contrast stimulus, healthy) and is displayed as a conventional gray-scale plot. Darker shading represents lower DLS. (f) Measurements of DLS over time form a complex spatial-temporal time series.


References
-
- Morgan JE (2012) Retina ganglion cell degeneration in glaucoma: an opportunity missed? A review. Clin Experiment Ophthalmol 40: 364–368. - PubMed
-
- Patel PJ, Chen FK, Da Cruz L, Rubin GS, Tufail A (2011) Contrast sensitivity outcomes in the ABC Trial: a randomized trial of bevacizumab for neovascular age-related macular degeneration. Invest Ophthalmol Vis Sci 52: 3089–3093. - PubMed
-
- Bainbridge JW, Smith AJ, Barker SS, Robbie S, Henderson R, et al. (2008) Effect of gene therapy on visual function in Leber's congenital amaurosis. N Engl J Med 358: 2231–2239. - PubMed
-
- Guo L, Duggan J, Cordeiro MF (2010) Alzheimer's disease and retinal neurodegeneration. Curr Alzheimer Res 7: 3–14. - PubMed
Publication types
MeSH terms
Grants and funding
LinkOut - more resources
Full Text Sources
Other Literature Sources
