

Assessing fishing and marine biodiversity changes using fishers' perceptions: the Spanish Mediterranean and Gulf of Cadiz case study
- PMID: 24465644
- PMCID: PMC3899065
- DOI: 10.1371/journal.pone.0085670
Assessing fishing and marine biodiversity changes using fishers' perceptions: the Spanish Mediterranean and Gulf of Cadiz case study
Abstract
Background: The expansion of fishing activities has intensively transformed marine ecosystems worldwide. However, available time series do not frequently cover historical periods.
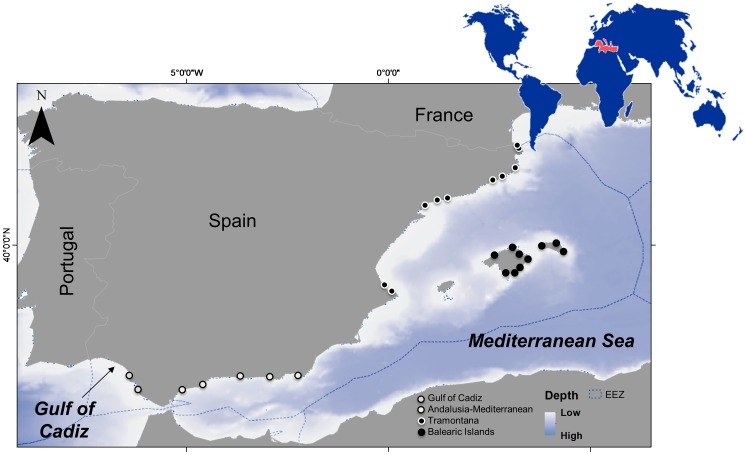
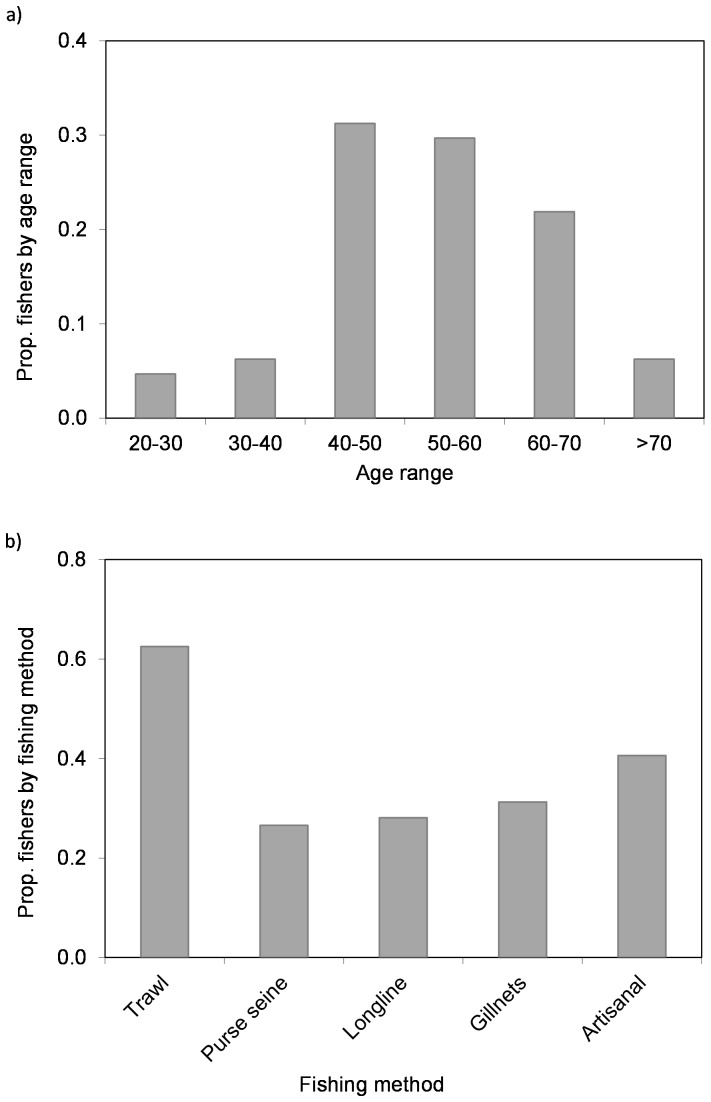
Methodology: Fishers' perceptions were used to complement data and characterise changes in fishing activity and exploited ecosystems in the Spanish Mediterranean Sea and Gulf of Cadiz. Fishers' interviews were conducted in 27 fishing harbours of the area, and included 64 fishers from ages between 20 to >70 years old to capture the experiences and memories of various generations. Results are discussed in comparison with available independent information using stock assessments and international convention lists.
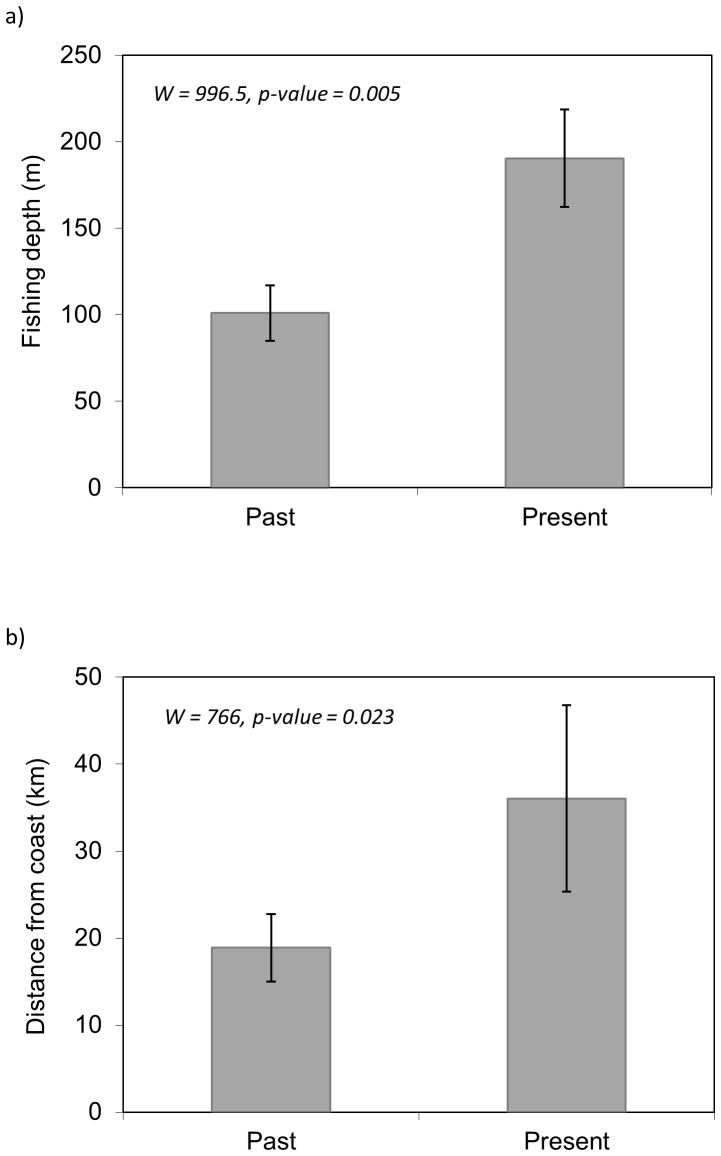
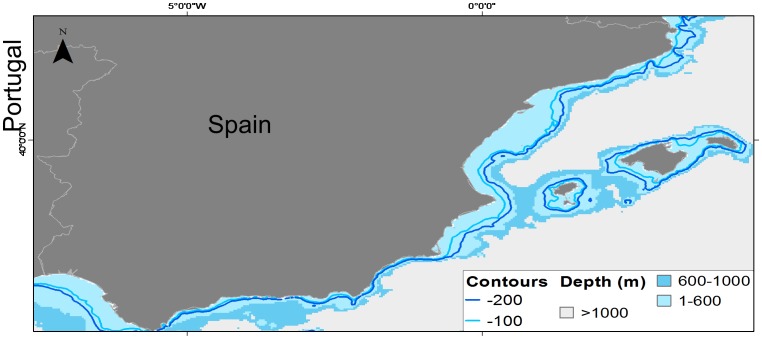
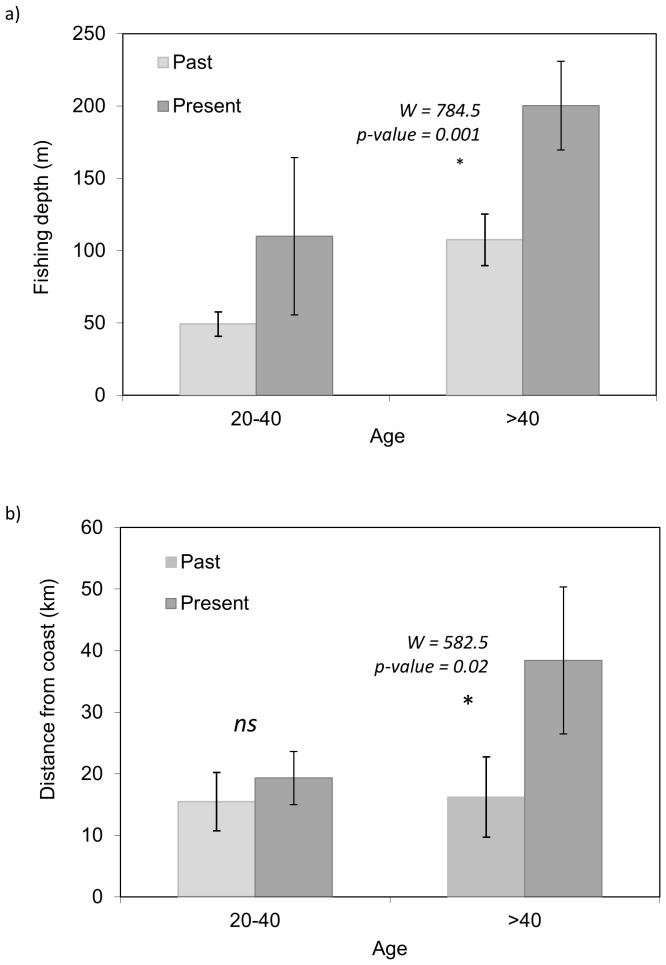
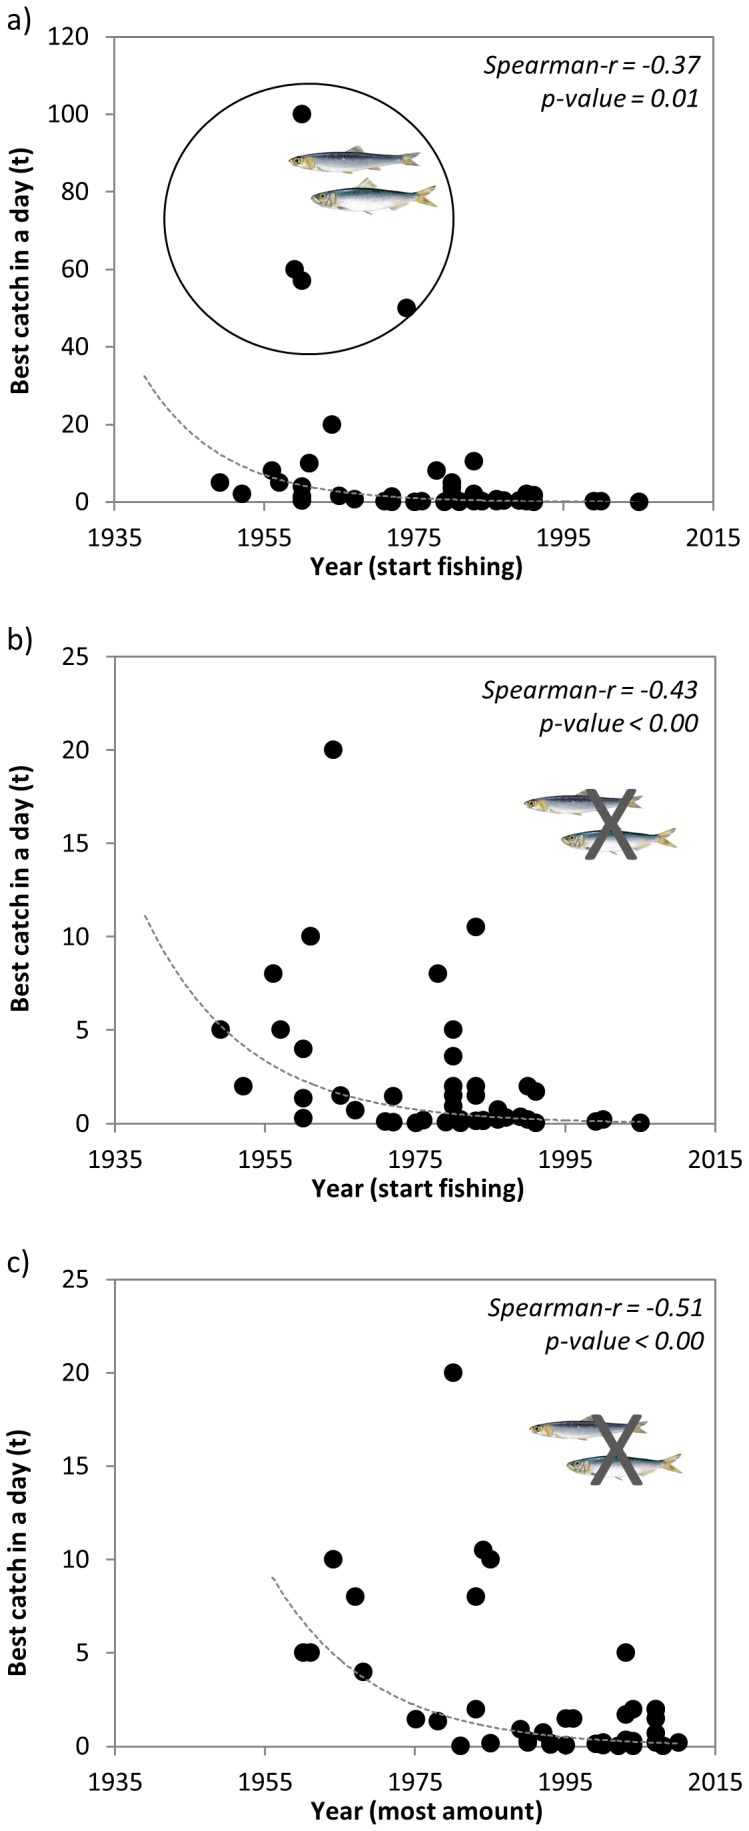
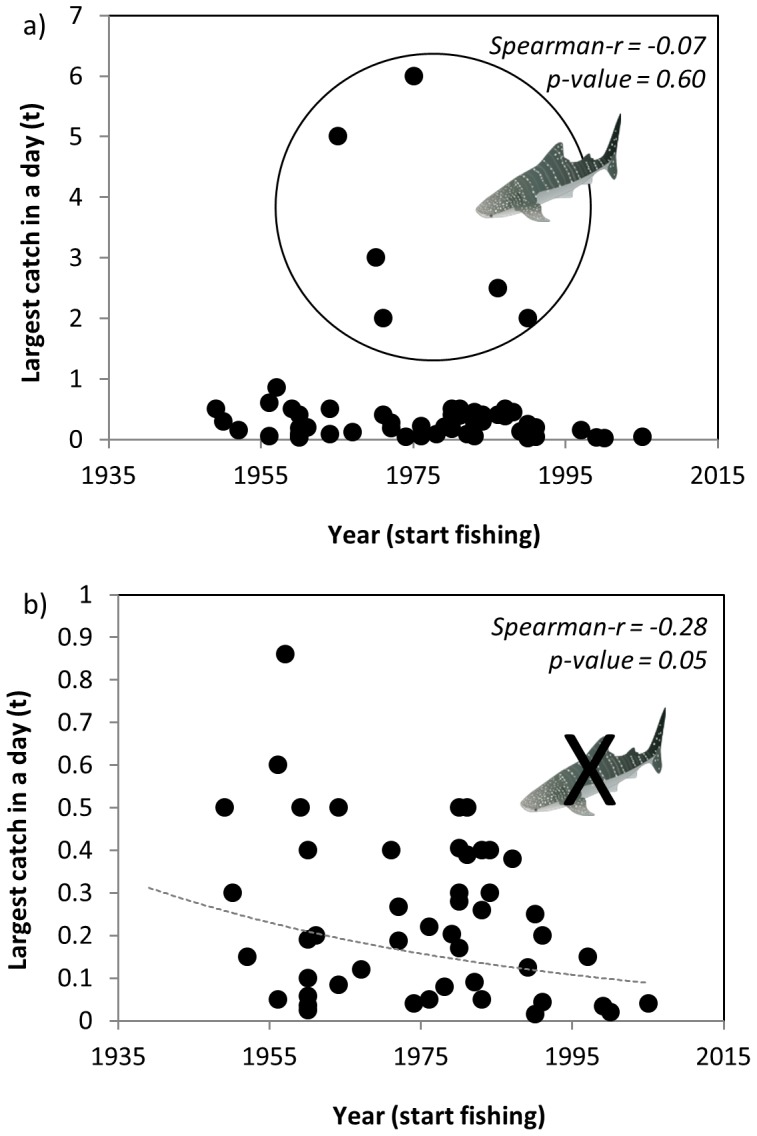
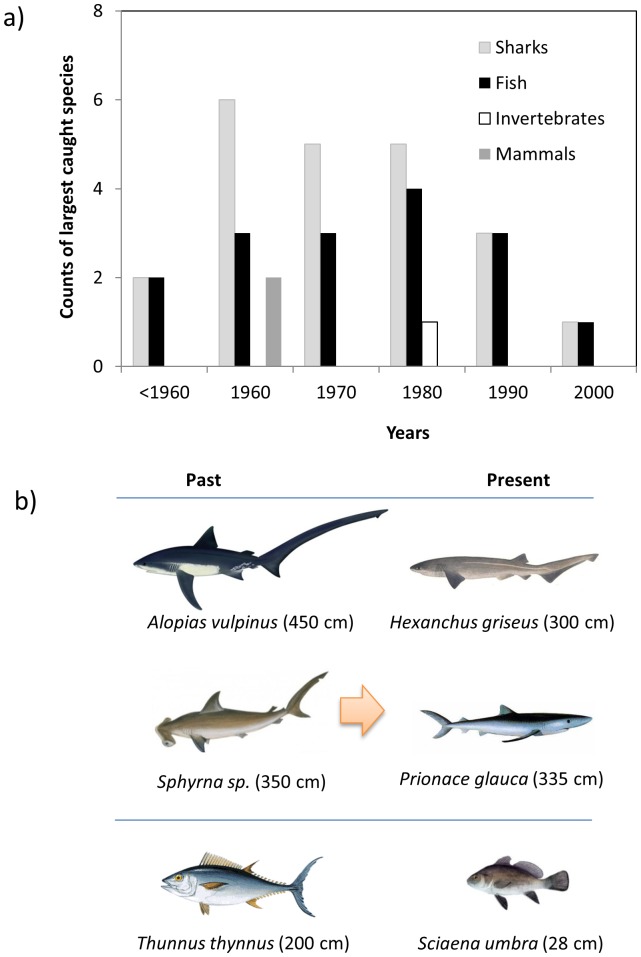
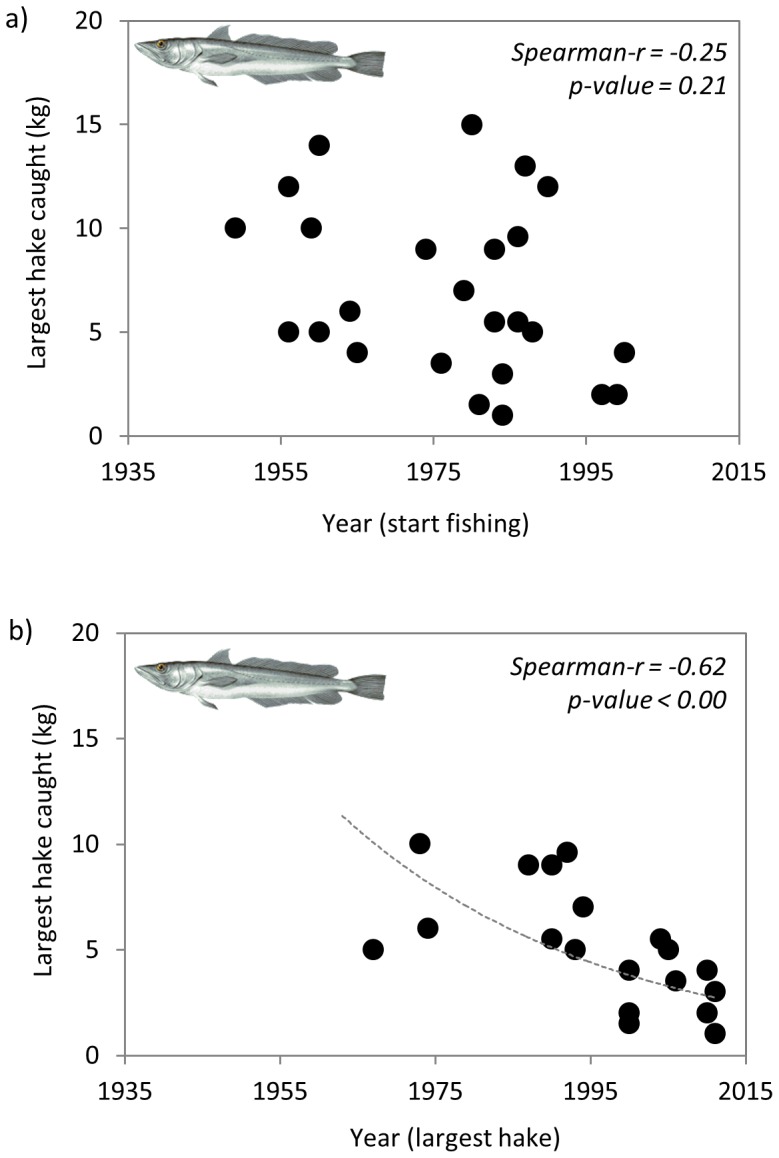
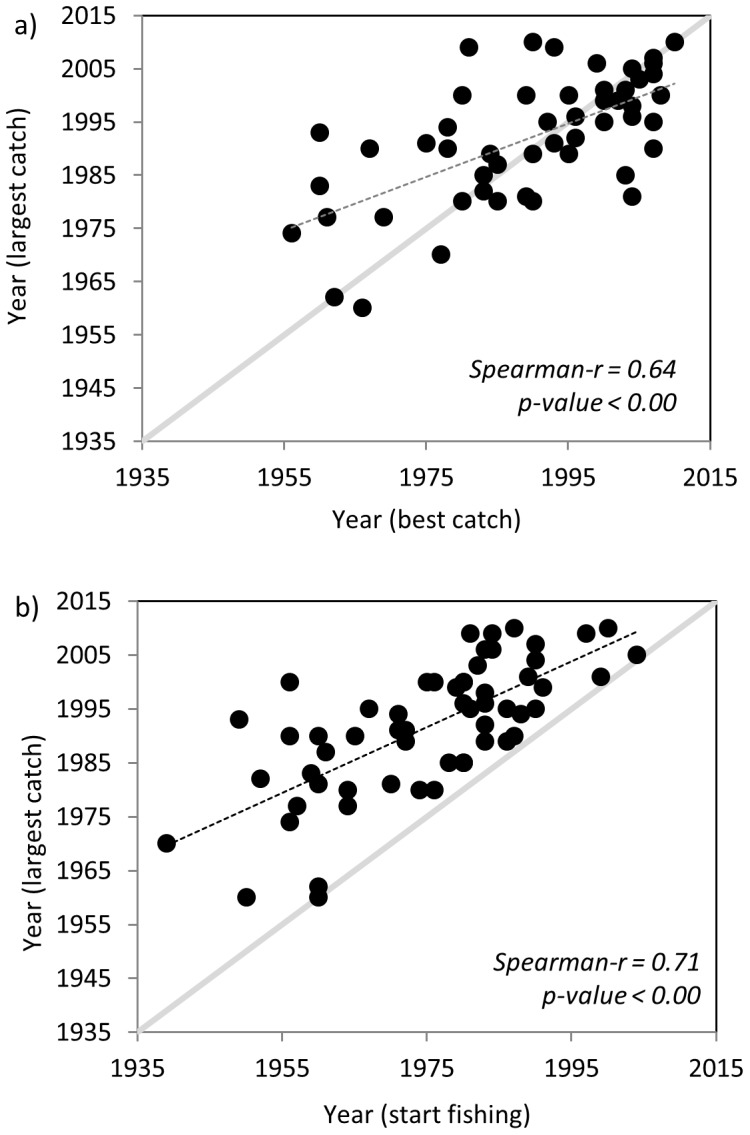
Principal findings: According to fishers, fishing activity substantially evolved in the area with time, expanding towards deeper grounds and towards areas more distant from the coast. The maximum amount of catch ever caught and the weight of the largest species ever captured inversely declined with time. Fishers (70%) cited specific fishing grounds where depletion occurred. They documented ecological changes of marine biodiversity during the last half of the century: 94% reported the decline of commercially important fish and invertebrates and 61% listed species that could have been extirpated, with frequent mentions to cartilaginous fish. Declines and extirpations were in line with available quantitative evaluations from stock assessments and international conventions, and were likely linked to fishing impacts. Conversely, half of interviewed fishers claimed that several species had proliferated, such as cephalopods, jellyfish, and small-sized fish. These changes were likely related to trophic cascades due to fishing and due to climate change effects. The species composition of depletions, local extinctions and proliferations showed differences by region suggesting that regional dynamics are important when analysing biodiversity changes.
Conclusions/significance: Using fishers' perceptions, fishing and ecological changes in the study area were documented. The recovery of local ecological knowledge provides valuable information complementing quantitative monitoring and evaluation surveys.
Conflict of interest statement
Figures
Similar articles
-
"Once upon a time in the Mediterranean" long term trends of Mediterranean fisheries resources based on fishers' Traditional Ecological Knowledge.PLoS One. 2015 Mar 17;10(3):e0119330. doi: 10.1371/journal.pone.0119330. eCollection 2015. PLoS One. 2015. PMID: 25781459 Free PMC article.
-
Harnessing Fishers' local knowledge and their perceptions: Opportunities to improve management of coastal fishing in Mediterranean marine protected areas.J Environ Manage. 2023 Oct 15;344:118456. doi: 10.1016/j.jenvman.2023.118456. Epub 2023 Jun 27. J Environ Manage. 2023. PMID: 37384984
-
Unraveling fishers' perceptions: Impact of mining on fish yield and diversity in Mwenga, South Kivu, Eastern Democratic Republic of Congo.Ecotoxicol Environ Saf. 2025 Mar 1;292:117953. doi: 10.1016/j.ecoenv.2025.117953. Epub 2025 Mar 3. Ecotoxicol Environ Saf. 2025. PMID: 40037081
-
The marine food chain in relation to biodiversity.ScientificWorldJournal. 2001 Oct 19;1:579-87. doi: 10.1100/tsw.2001.85. ScientificWorldJournal. 2001. PMID: 12805852 Free PMC article. Review.
-
The northern shrimp (Pandalus borealis) offshore fishery in the Northeast Atlantic.Adv Mar Biol. 2007;52:147-266. doi: 10.1016/S0065-2881(06)52002-4. Adv Mar Biol. 2007. PMID: 17298891 Review.
Cited by
-
Historical Patterns and Drivers of Spatial Changes in Recreational Fishing Activity in Puget Sound, Washington.PLoS One. 2016 Apr 7;11(4):e0152190. doi: 10.1371/journal.pone.0152190. eCollection 2016. PLoS One. 2016. PMID: 27054890 Free PMC article.
-
Stakeholder engagement vs. social distancing-how does the Covid-19 pandemic affect participatory research in EU marine science projects?Marit Stud. 2021;20(2):189-205. doi: 10.1007/s40152-021-00223-4. Epub 2021 May 14. Marit Stud. 2021. PMID: 35300281 Free PMC article.
-
Riverine fishers' knowledge of extreme climatic events in the Brazilian Amazonia.J Ethnobiol Ethnomed. 2016 Oct 26;12(1):50. doi: 10.1186/s13002-016-0123-x. J Ethnobiol Ethnomed. 2016. PMID: 27784304 Free PMC article.
-
Current Challenges of Vaccination in Fish Health Management.Animals (Basel). 2024 Sep 16;14(18):2692. doi: 10.3390/ani14182692. Animals (Basel). 2024. PMID: 39335281 Free PMC article. Review.
-
Coastal marine habitats deterioration according to users' perception: the case of Cap de Creus Marine Protected Area (NE Spain).Reg Environ Change. 2024;24(4):155. doi: 10.1007/s10113-024-02322-4. Epub 2024 Oct 10. Reg Environ Change. 2024. PMID: 39399390 Free PMC article.
References
-
- Brown C, Corcoran E, Herkenrath P, Thonell J (2006) Marine and coastal ecosystems and human well-being: a synthesis report based on the findings of the Millennium Ecosystem Assessment; 92-807-2679-X UNEPNI, editor. 64 p.
-
- Jackson JBC, Kirby MX, Berger WH, Bjorndal KA, Botsford LW, et al. (2001) Historical overfishing and the recent collapse of coastal ecosystems. Science 293: 629–638. - PubMed
-
- Lotze HK, Lenihan HS, Bourque BJ, Bradbury RH, Cooke RG, et al. (2006) Depletion, degradation, and recovery potential of estuaries and coastal seas. Science 312: 1806–1809. - PubMed
Publication types
MeSH terms
LinkOut - more resources
Full Text Sources
Other Literature Sources
