. 2014 Jan 17;9(1):e85731.
doi: 10.1371/journal.pone.0085731. eCollection 2014.

Application of a genetically encoded biosensor for live cell imaging of L-valine production in pyruvate dehydrogenase complex-deficient Corynebacterium glutamicum strains

Affiliations

Application of a genetically encoded biosensor for live cell imaging of L-valine production in pyruvate dehydrogenase complex-deficient Corynebacterium glutamicum strains

Nurije Mustafi et al. PLoS One. .

Abstract

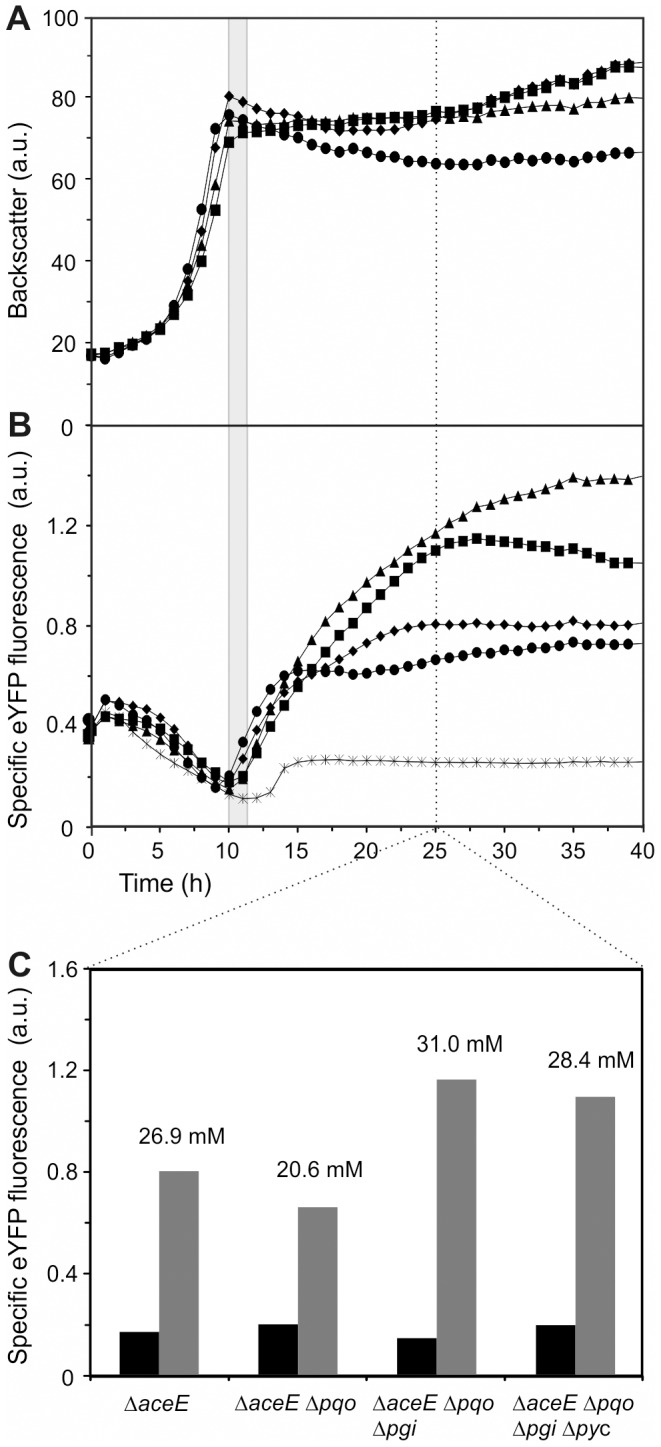
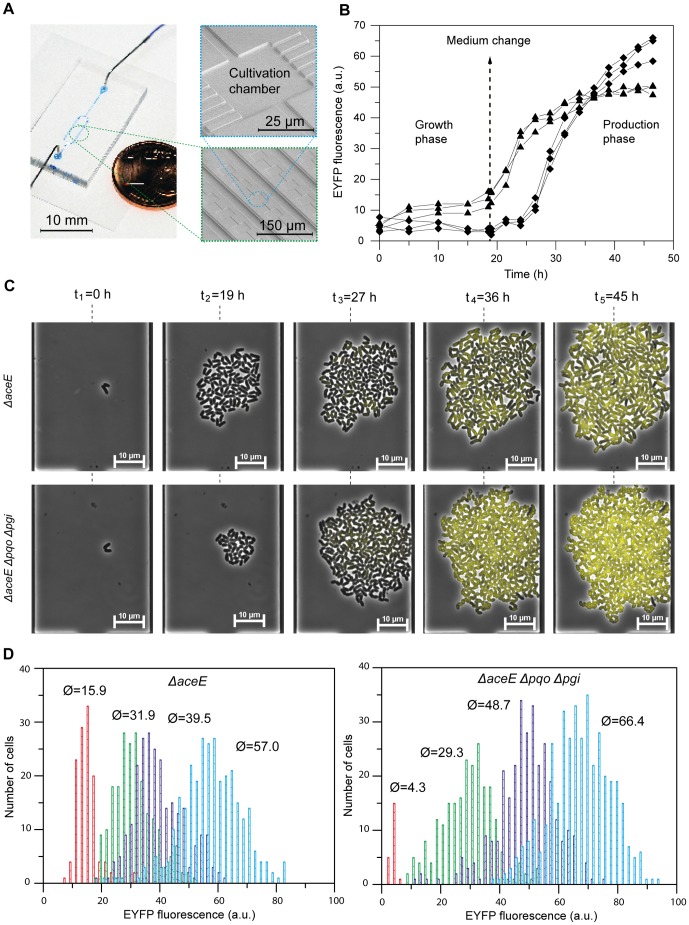
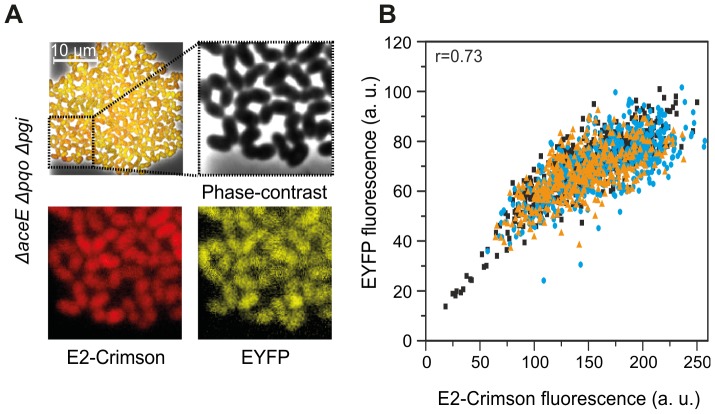
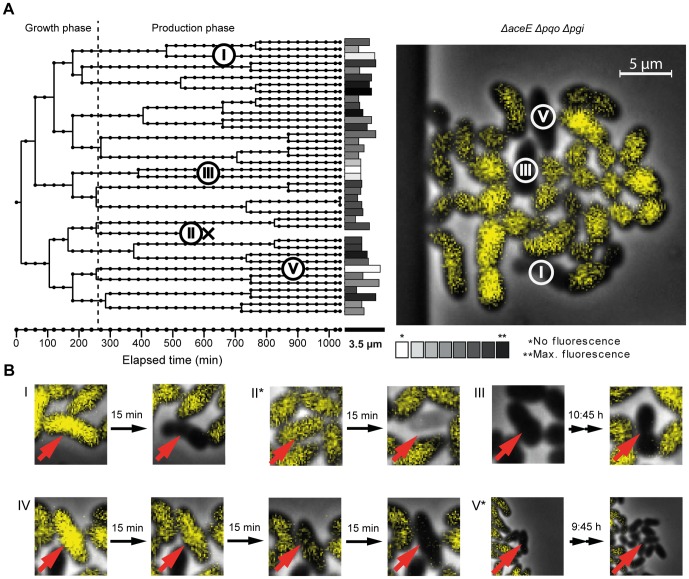
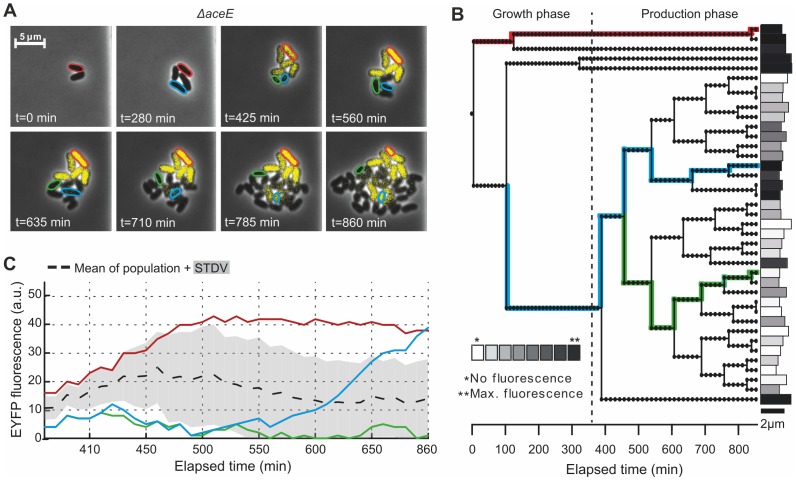
The majority of biotechnologically relevant metabolites do not impart a conspicuous phenotype to the producing cell. Consequently, the analysis of microbial metabolite production is still dominated by bulk techniques, which may obscure significant variation at the single-cell level. In this study, we have applied the recently developed Lrp-biosensor for monitoring of amino acid production in single cells of gradually engineered L-valine producing Corynebacterium glutamicum strains based on the pyruvate dehydrogenase complex-deficient (PDHC) strain C. glutamicum ΔaceE. Online monitoring of the sensor output (eYFP fluorescence) during batch cultivation proved the sensor's suitability for visualizing different production levels. In the following, we conducted live cell imaging studies on C. glutamicum sensor strains using microfluidic chip devices. As expected, the sensor output was higher in microcolonies of high-yield producers in comparison to the basic strain C. glutamicum ΔaceE. Microfluidic cultivation in minimal medium revealed a typical Gaussian distribution of single cell fluorescence during the production phase. Remarkably, low amounts of complex nutrients completely changed the observed phenotypic pattern of all strains, resulting in a phenotypic split of the population. Whereas some cells stopped growing and initiated L-valine production, others continued to grow or showed a delayed transition to production. Depending on the cultivation conditions, a considerable fraction of non-fluorescent cells was observed, suggesting a loss of metabolic activity. These studies demonstrate that genetically encoded biosensors are a valuable tool for monitoring single cell productivity and to study the phenotypic pattern of microbial production strains.


Conflict of interest statement

Competing Interests: The authors have declared that no competing interests exist.

Figures

Figure 1
Figure 1. Biosensor-based online monitoring of L-valine production in PDHC-deficient C. glutamicum strains.
(A) Growth and (B) Lrp-sensor output (eYFP fluorescence) of the sensor strains C. glutamicum ATCC 13032 wild type (stars), ΔaceE (diamonds), ΔaceE Δpqo (circles), ΔaceE Δpqo Δpgi (triangles), and ΔaceE Δpqo Δpgi Δpyc (squares) cultivated in CGXII minimal medium containing 222 mM glucose and 154 mM acetate. Data represent average values of three independent cultivations. The transition of the producer strains into the stationary and production phase is highlighted by the grey area. (C) EYFP fluorescence of respective strains at the beginning of the production phase (black bars) and twelve hours after the initiation of L-valine production (grey bars). L-valine concentration (mM) in the supernatant of the respective strain 25 h after beginning of cultivation as measured by HPLC is indicated above the grey bars.
Figure 2
Figure 2. Live cell imaging of L-valine production strains using microfluidic monolayer cultivation chambers
. (A) Illustration of the microfluidic cultivation chambers. The system consists of several arrays of picoliter sized monolayer cultivation chambers. (B) Fluorescence emission of three entire microcolonies (average eYFP signal per colony area) of the ΔaceE sensor strain (triangles) and the ΔaceE Δpqo Δpgi sensor strain (diamonds) over time. Fluorescence was measured every 2.5 h. (C) Growth (t1–t2) and production phase (t3–t5) of isogenic microcolonies of the ΔaceE sensor strain (upper row) and the ΔaceE Δpqo Δpgi sensor strain (lower row). (D) Histograms illustrating fluorescence distribution within a representative microcolony of the ΔaceE sensor strain (left) and the ΔaceE Δpqo Δpgi sensor strain (right). The eYFP signal of single cells was measured at t = 19 h (red), t = 26 h (green), t = 34 h (purple), and t = 46 h (blue). Average fluorescence values are indicated above the respective peaks. All cultivations were performed in microfluidic chambers shown in (A) in CGXII minimal medium containing 154 mM acetate and 222 mM glucose during growth phase or CGXII with 222 mM glucose during the production phase, respectively.
Figure 3
Figure 3. Correlation of the Lrp-sensor output (eYFP) and the plasmid marker E2-Crimson.
(A) Microscopy overlay plot of phase-contrast, eYFP and E2-Crimson signal of an isogenic microcolony of the ΔaceE Δpqo Δpgi sensor strain after 46 h (see Figure 2C). (B) Dot plot displaying eYFP and E2-Crimson signal of single cells of three isogenic microcolonies (triangles, circles, and diamonds) of the ΔaceE Δpqo Δpgi sensor strain.
Figure 4
Figure 4. Occurrence of non-fluorescent cells during the production phase.
(A) Microcolony and lineage tree of the ΔaceE Δpqo Δpgi sensor strain. Different types of non-fluorescent cells are illustrated in B. (B) (I+II) Lysing cells and (III) dormant/or dead cell, which do not switch from growth to production. (IV) Leaky cell that shows decreasing fluorescence signal over time, potentially caused by a permeabilized cell membrane. (V*) Cells showing slow growth, but no production. Images marked with an asterisk show cells of another microcolony of the ΔaceE Δpqo Δpgi sensor strain, not shown in this figure.
Figure 5
Figure 5. Biosensor-driven analysis of phenotypic heterogeneity.
In the presence of low amounts of complex carbon sources, significant cell-to-cell variability in the switch from growth to L-valine production was observed. (A) Growth and production phase (initiated after 340 min) of an isogenic microcolony of the ΔaceE sensor strain and (B) the lineage tree of the respective microcolony highlighting several single cell traces. EYFP fluorescence was quantified in single cells after 860 min. (C) Single cell traces of fluorescence output of marked cells (see A and B) and average emission of the whole colony (black, dashed line, SD  =  grey shading). Cultivation was performed in CGXII minimal medium containing 154 mM acetate, 222 mM glucose and 0.5% BHI during growth phase or 222 mM glucose and 0.5% BHI during production phase, respectively.

Similar articles

Cited by

References

    1. Lidstrom ME, Konopka MC (2010) The role of physiological heterogeneity in microbial population behavior. Nat Chem Biol 6: 705–712. - PubMed
    1. Kussell E, Leibler S (2005) Phenotypic diversity, population growth, and information in fluctuating environments. Science 309: 2075–2078. - PubMed
    1. Acar M, Mettetal JT, van Oudenaarden A (2008) Stochastic switching as a survival strategy in fluctuating environments. Nature Genetics 40: 471–475. - PubMed
    1. Veening J-W, Smits WK, Kuipers OP (2008) Bistability, epigenetics, and bet-hedging in bacteria. Ann Rev Microbiol 62: 193–210. - PubMed
    1. Müller S, Harms H, Bley T (2010) Origin and analysis of microbial population heterogeneity in bioprocesses. Curr Op Biotechnol 21: 100–113. - PubMed

Publication types

LinkOut - more resources