. 2014 Jan 21;9(1):e85732.
doi: 10.1371/journal.pone.0085732. eCollection 2014.

Signal intensities derived from different NMR probes and parameters contribute to variations in quantification of metabolites

Affiliations

Signal intensities derived from different NMR probes and parameters contribute to variations in quantification of metabolites

Paige Lacy et al. PLoS One. .

Erratum in

  • PLoS One. 2014;9(7):e102929

Abstract

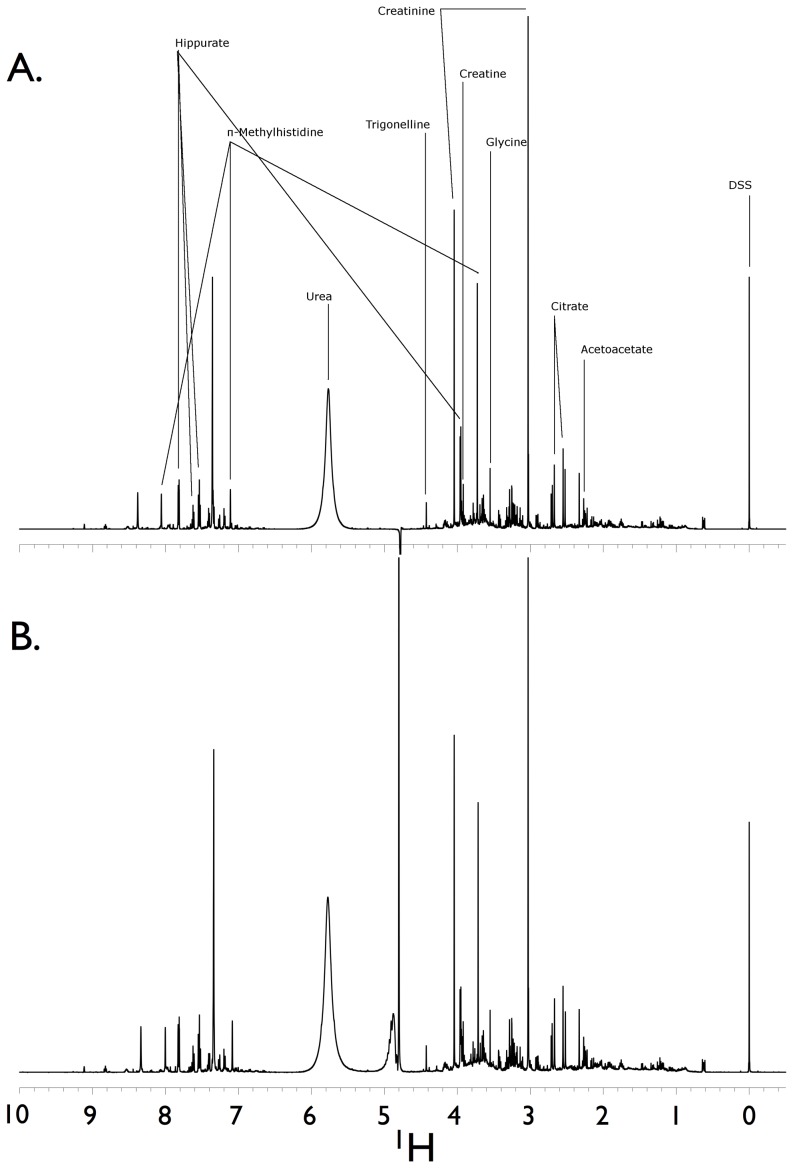
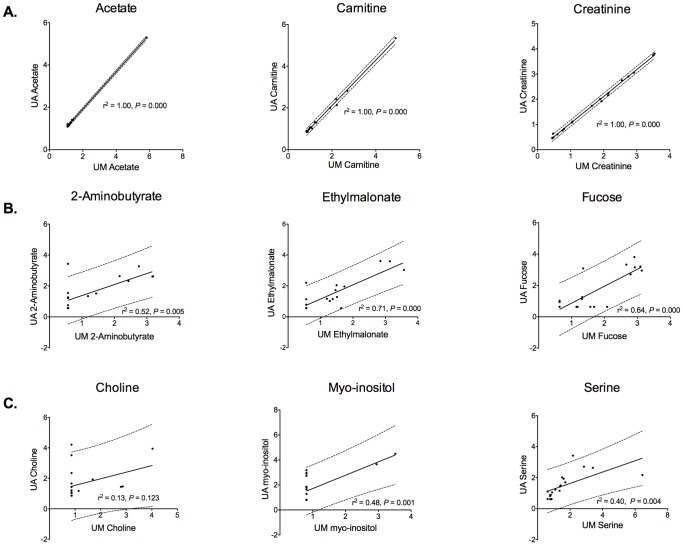
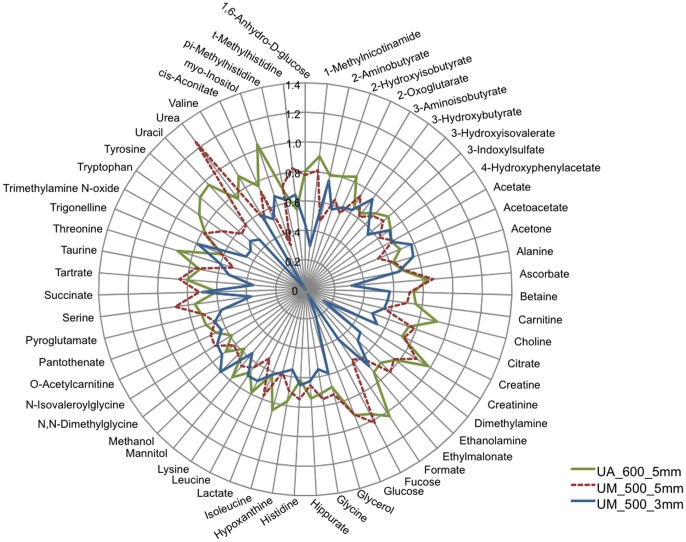
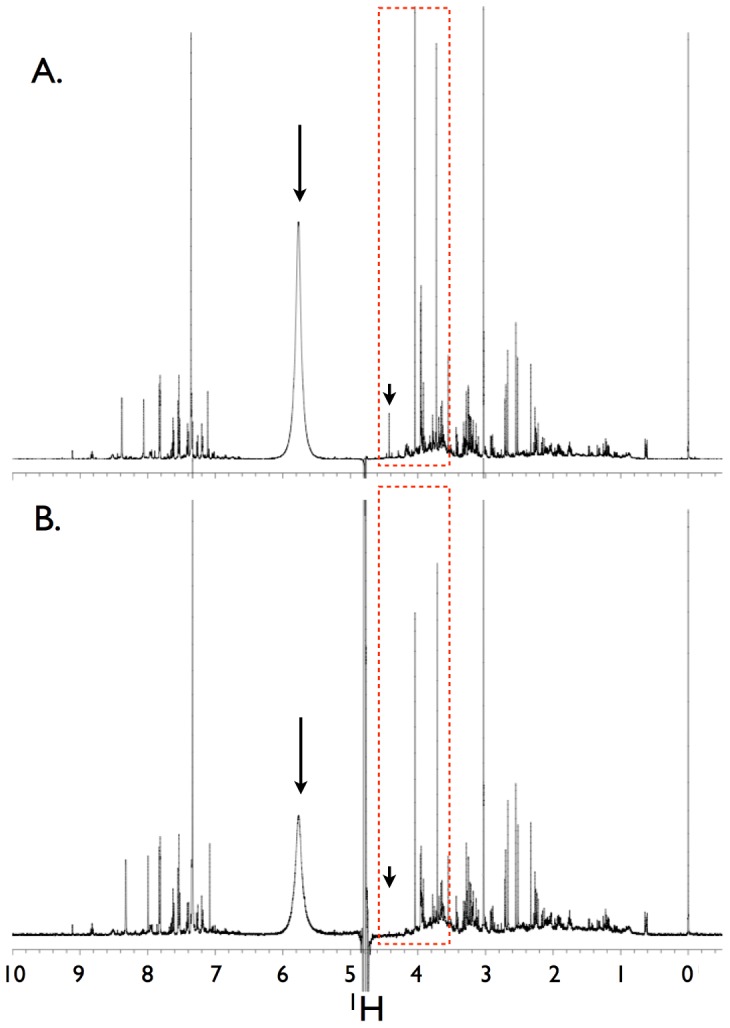
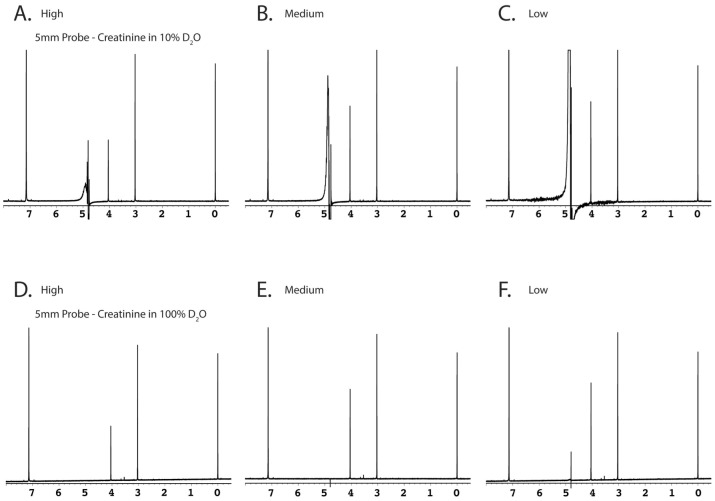
We discovered that serious issues could arise that may complicate interpretation of metabolomic data when identical samples are analyzed at more than one NMR facility, or using slightly different NMR parameters on the same instrument. This is important because cross-center validation metabolomics studies are essential for the reliable application of metabolomics to clinical biomarker discovery. To test the reproducibility of quantified metabolite data at multiple sites, technical replicates of urine samples were assayed by 1D-(1)H-NMR at the University of Alberta and the University of Michigan. Urine samples were obtained from healthy controls under a standard operating procedure for collection and processing. Subsequent analysis using standard statistical techniques revealed that quantitative data across sites can be achieved, but also that previously unrecognized NMR parameter differences can dramatically and widely perturb results. We present here a confirmed validation of NMR analysis at two sites, and report the range and magnitude that common NMR parameters involved in solvent suppression can have on quantitated metabolomics data. Specifically, saturation power levels greatly influenced peak height intensities in a frequency-dependent manner for a number of metabolites, which markedly impacted the quantification of metabolites. We also investigated other NMR parameters to determine their effects on further quantitative accuracy and precision. Collectively, these findings highlight the importance of and need for consistent use of NMR parameter settings within and across centers in order to generate reliable, reproducible quantified NMR metabolomics data.


Conflict of interest statement

Competing Interests: Kathleen Stringer and Alla Karnovsky receive research funding from the National Institutes of Health and Department of Health and Human Services, United States. Michael J. Lewis and David Chang were affiliated with the commercial entity, Chenomx, Inc. (10230 Jasper Ave NW, Edmonton, AB T5J 4P6, Canada) at the time this work was performed. All remaining authors have no competing interests to declare. None of these competing interests alter the authors' adherence to all the PLOS ONE policies on sharing data and material.

Figures

Figure 1
Figure 1. Hydrogen NMR spectra of two technical replicates of a single volunteer human urine sample.
Data were collected on two separate NMR spectrometers. The first replicate (A) was run on a Varian VNMRS 600 MHz spectrometer equipped with 5 mm HX probe and a 768AS (automatic sample handling) robotic system at the University of Alberta. The second replicate (B) was run on a Varian VNMRS 500 MHz equipped with a 5 mm “One-probe” with Z-axis pulsed field gradients and an Agilent/Varian 7510-AS sample handling system at the University of Michigan's Biochemical NMR Core Laboratory. The induced saturation power or γB1 (and calibrated excitation pulses) for the 600 and 500 MHz spectrometer data was 80 Hz (90° pulse) and 98 Hz (96° pulse was the default robotic setting), respectively. A representative number of named metabolites and their assigned spectral peaks are shown as well as the internal standard, DSS. DSS = 4,4-dimethyl-4-silapentane-1-sulfonic acid.
Figure 2
Figure 2. Representative Pearson linear regression plots with associated 95% prediction bands (dashed lines) of selected urine metabolites (normalized data).
These data show: (A) a high degree of correlation (r2 = 1.0), acetate, carnitine, and creatinine; (B) a moderate degree of correlation (r2≥0.5, <0.9), 2-aminobutyrate, ethylmalonate, and fucose; and (C) a low degree of correlation (r2<0.5), choline, myo-inositol, and serine. All data shown are from 1H-NMR spectra acquired from technical replicate samples using 5 mm probes at the University of Alberta (UA) and the University of Michigan (UM). In all cases, the correlation p value was significant with the exception of choline (p = 0.123).
Figure 3
Figure 3. Radar plot of the normalized quantified 1H-NMR urine metabolites.
The plot permits the visualization of the similarities and discrepancies between the data generated using a 5(University of Alberta (UA), and University of Michigan (UM)), and a 3 mm probe (UM). The data are the mean of the normalized values for each metabolite. Overall, the results from the 5 mm probes are more similar to each other than those from the 3 mm probe (also see Fig. S2 and Fig. S3).
Figure 4
Figure 4. Effects of solvent suppression using two different probes on the same sample.
The spectra were acquired utilizing the identical NMR pulse sequence as in Figure 1, with the exception that (A) was acquired using a 5 mm probe on a 600 MHz spectrometer at the University of Alberta and (B) was acquired using a 3 mm HX probe with Z-axis pulsed field gradients on a 500 MHz spectrometer at the University of Michigan. The decibel value of both settings for excitation and saturation were maintained between probes. However, due to probe design differences, the resulting pulse width for the 3 mm probe was 120° (same instrument decibel setting), and the saturation power for this probe resulted in a γB1-induced field of 226 Hz or 8 dB. The difference in metabolite intensities (e.g., urea at ∼5.8 PPM, and sharp peaks at ∼4.0 and ∼3.75 PPM) in the same urine sample is readily evident. This inspired our extensive investigation to identify which experimental parameters were responsible for these differences, and to determine how the sensitivity of the metabolite resultants changed in response to several common NMR parameters (see text for details). The large arrows designate urea peaks, the small arrows indicate trigonelline (which was not observed in the 3 mm probe spectrum), and the red dashed-line boxes represent a region of the spectra that exhibited marked peak suppression, particularly around 4.5 PPM, near the water region.
Figure 5
Figure 5. Comparison of changes in 1D-1H NMR spectra using different saturation powers.
Samples were run utilizing either 5(A–L) or 3 mm probes (M–X). (A–F) and (M–R) show the effects of different saturation powers on synthetic creatinine (2 mM) dissolved in either 10% D2O (A–C and M–O), or >99.8% D2O (D–F and P–R). Two human volunteer urine samples were selected to represent a relatively high (G–I and S–U) and low urea concentration (J–L and V–X). Saturation powers yielding induced field strengths of 195 Hz, 80 Hz, and 20 Hz are shown in left, middle and right panels, respectively. Note the large increase in urea signal intensity (e.g., A to B) when saturation power is just slightly diminished, indicating the amount of saturation transfer between exchanging atoms even in high D2O solvent conditions. The two samples with different urea concentrations were selected to elucidate the effect of urea/solvent exchange in a saturating system.

Similar articles

Cited by

References

    1. Nicholson JK, Lindon JC (2008) Systems biology: Metabonomics. Nature 455: 1054–1056. - PubMed
    1. Psychogios N, Hau DD, Peng J, Guo AC, Mandal R, et al. (2011) The human serum metabolome. PloS one 6: e16957. - PMC - PubMed
    1. Bouatra S, Aziat F, Mandal R, Guo AC, Wilson MR, et al. (2013) The human urine metabolome. PloS one 8: e73076. - PMC - PubMed
    1. Dunn WB, Broadhurst DI, Atherton HJ, Goodacre R, Griffin JL (2011) Systems level studies of mammalian metabolomes: the roles of mass spectrometry and nuclear magnetic resonance spectroscopy. Chem Soc Rev 40: 387–426. - PubMed
    1. Foxall PJ, Parkinson JA, Sadler IH, Lindon JC, Nicholson JK (1993) Analysis of biological fluids using 600 MHz proton NMR spectroscopy: application of homonuclear two-dimensional J-resolved spectroscopy to urine and blood plasma for spectral simplification and assignment. J Pharm Biomed Anal 11: 21–31. - PubMed

Publication types

LinkOut - more resources