

A 50-m forest cover map in Southeast Asia from ALOS/PALSAR and its application on forest fragmentation assessment
- PMID: 24465714
- PMCID: PMC3899076
- DOI: 10.1371/journal.pone.0085801
A 50-m forest cover map in Southeast Asia from ALOS/PALSAR and its application on forest fragmentation assessment
Abstract
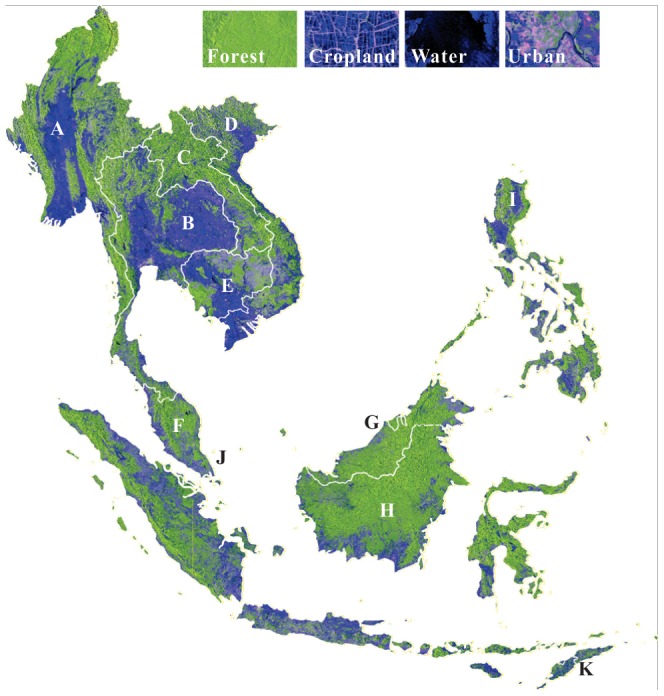
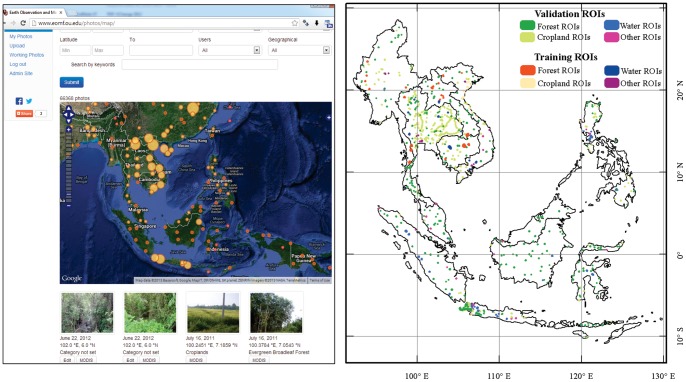
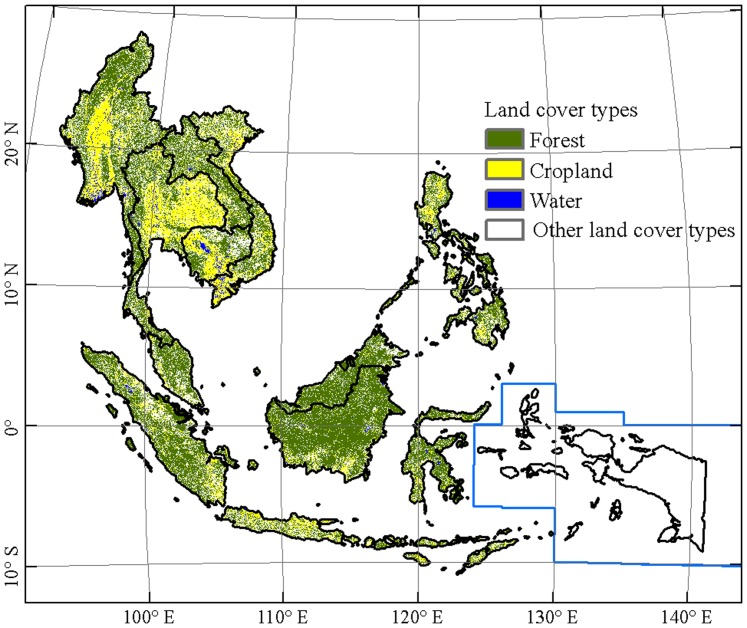
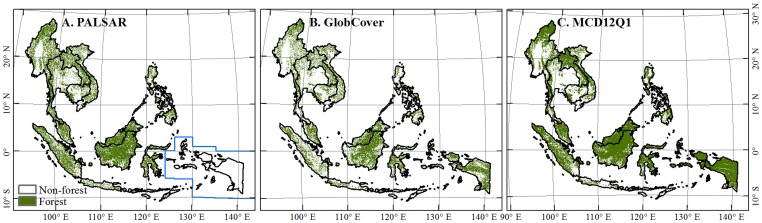
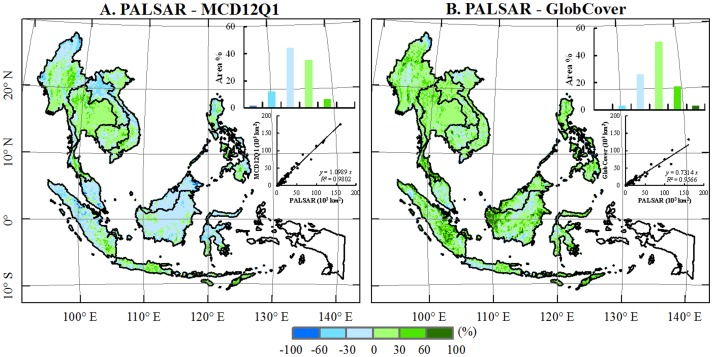
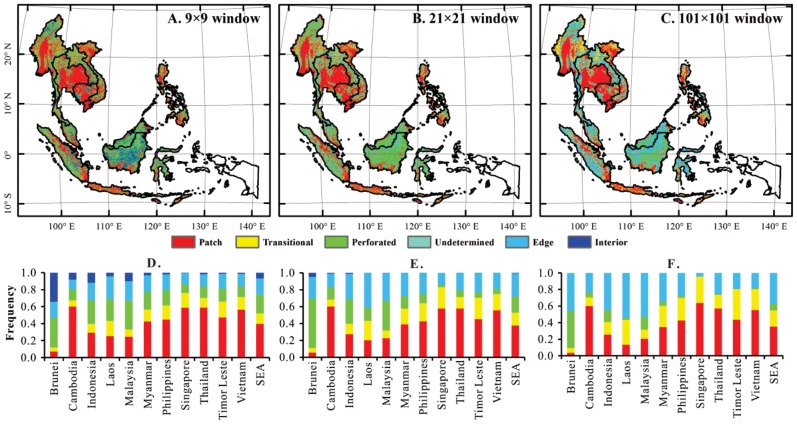
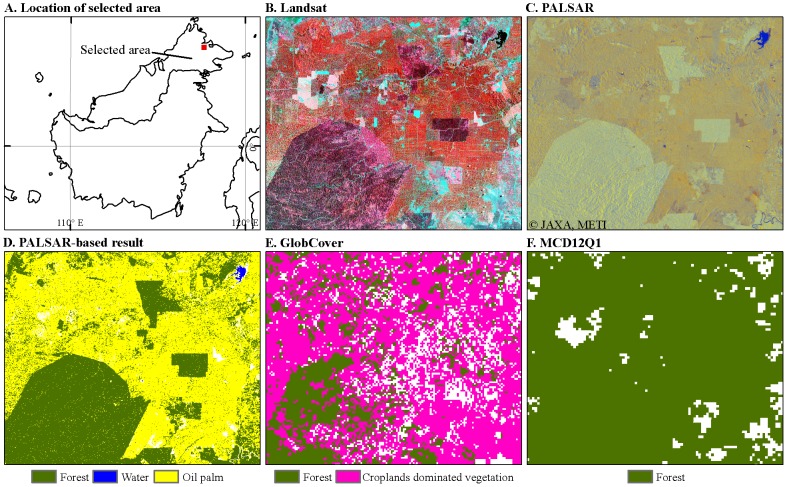
Southeast Asia experienced higher rates of deforestation than other continents in the 1990s and still was a hotspot of forest change in the 2000s. Biodiversity conservation planning and accurate estimation of forest carbon fluxes and pools need more accurate information about forest area, spatial distribution and fragmentation. However, the recent forest maps of Southeast Asia were generated from optical images at spatial resolutions of several hundreds of meters, and they do not capture well the exceptionally complex and dynamic environments in Southeast Asia. The forest area estimates from those maps vary substantially, ranging from 1.73×10(6) km(2) (GlobCover) to 2.69×10(6) km(2) (MCD12Q1) in 2009; and their uncertainty is constrained by frequent cloud cover and coarse spatial resolution. Recently, cloud-free imagery from the Phased Array Type L-band Synthetic Aperture Radar (PALSAR) onboard the Advanced Land Observing Satellite (ALOS) became available. We used the PALSAR 50-m orthorectified mosaic imagery in 2009 to generate a forest cover map of Southeast Asia at 50-m spatial resolution. The validation, using ground-reference data collected from the Geo-Referenced Field Photo Library and high-resolution images in Google Earth, showed that our forest map has a reasonably high accuracy (producer's accuracy 86% and user's accuracy 93%). The PALSAR-based forest area estimates in 2009 are significantly correlated with those from GlobCover and MCD12Q1 at national and subnational scales but differ in some regions at the pixel scale due to different spatial resolutions, forest definitions, and algorithms. The resultant 50-m forest map was used to quantify forest fragmentation and it revealed substantial details of forest fragmentation. This new 50-m map of tropical forests could serve as a baseline map for forest resource inventory, deforestation monitoring, reducing emissions from deforestation and forest degradation (REDD+) implementation, and biodiversity.
Conflict of interest statement
Figures
References
-
- Pimm SL, Raven P (2000) Biodiversity - Extinction by numbers. Nature 403: 843–845. - PubMed
-
- Fearnside PM (2000) Global warming and tropical land-use change: Greenhouse gas emissions from biomass burning, decomposition and soils in forest conversion, shifting cultivation and secondary vegetation. Climatic Change 46: 115–158.
-
- FAO (2013) FAOSTAT Database on Population. Rome, Italy: FAO.
-
- Stibig HJ, Achard F, Fritz S (2004) A new forest cover map of continental southeast Asia derived from SPOT-VEGETATION satellite imagery. Applied Vegetation Science 7: 153–162.
-
- Skole D, Tucker C (1993) Tropical Deforestation and Habitat Fragmentation in the Amazon - Satellite Data from 1978 to 1988. Science 260: 1905–1910. - PubMed
Publication types
MeSH terms
LinkOut - more resources
Full Text Sources
Other Literature Sources
