. 2014 Jan 17;9(1):e85817.
doi: 10.1371/journal.pone.0085817. eCollection 2014.

Actin filaments at the leading edge of cancer cells are characterized by a high mobile fraction and turnover regulation by profilin I

Affiliations

Actin filaments at the leading edge of cancer cells are characterized by a high mobile fraction and turnover regulation by profilin I

Gisela Lorente et al. PLoS One. .

Abstract

Cellular motility is the basis for cancer cell invasion and metastasis. In the case of breast cancer, the most common type of cancer among women, metastasis represents the most devastating stage of the disease. The central role of cellular motility in cancer development emphasizes the importance of understanding the specific mechanisms involved in this process. In this context, tumor development and metastasis would be the consequence of a loss or defect of the mechanisms that control cytoskeletal remodeling. Profilin I belongs to a family of small actin binding proteins that are thought to assist in actin filament elongation at the leading edge of migrating cells. Traditionally, Profilin I has been considered to be an essential control element for actin polymerization and cell migration. Expression of Profilin I is down-regulated in breast and various other cancer cells. In MDA-MB-231 cells, a breast cancer cell line, further inhibition of Profilin I expression promotes hypermotility and metastatic spread, a finding that contrasts with the proposed role of Profilin in enhancing polymerization. In this report, we have taken advantage of the fluorescence recovery after photobleaching (FRAP) of GFP-actin to quantify and compare actin dynamics at the leading edge level in both cancer and non-cancer cell models. Our results suggest that (i) a high level of actin dynamics (i.e., a large mobile fraction of actin filaments and a fast turnover) is a common characteristic of some cancer cells; (ii) actin polymerization shows a high degree of independence from the presence of extracellular growth factors; and (iii) our results also corroborate the role of Profilin I in regulating actin polymerization, as raising the intracellular levels of Profilin I decreased the mobile fraction ratio of actin filaments and slowed their polymerization rate; furthermore, increased Profilin levels also led to reduced individual cell velocity and directionality.


Conflict of interest statement

Competing Interests: The authors have declared that no competing interests exist.

Figures

Figure 1
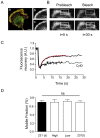
Figure 1. The actin cytoskeleton at the leading edge of MDA-MB-231 is characterized by a high mobile fraction and dynamics.
A) MDA-MB-231 cells transfected with GFP-actin, double stained with Phalloidin-Alexa 594 (a). Actin fluorescence accumulates mainly at the leading edge area. Scale bar 5 µm. Notice that MDA-MB-231 cells have a conspicuous lack of actin stress fibers. Rigth: Detailed section of the leading edge, showing the accumulation of GFP-actin (b) and actin filaments (c). Scale bar 2 µm. B) Representative picture frames from sequential FRAP experiments. Before FRAP (pre-bleaching), after high-intensity laser exposure (bleaching), during the initial phase of recovery (5 s) and at the end of the stable part of the curve (30 s). The bleached leading edge area is indicated by the white box (4×6 µm). C) Example of a FRAP experiment; fluorescence recovers to an average value of 71.5±4% following a monoexponential time course (fit depicted by a red dotted line). Incubation with cytochalasin D (90 nM) inhibits fluorescence recovery (CytD). D) Summary graph of the mean mobile fractions from MDA-MB-231 cells. Stable transfected cells (s, n = 44), high GFP-actin expressers (high, n = 10), low GFP-actin expressers (low, n = 10) and transiently transfected cells (231t, n = 6). Mean values of mobile fraction do not show statistical differences under any experimental conditions when compared with the stable transfected cell line (Student's t-test).
Figure 2
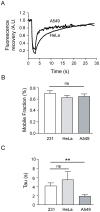
Figure 2. A highly dynamic cytoskeleton is a characteristic of tumor cell lines.
A) Two examples of individual fluorescence recovery of GFP-actin obtained from A549 and HeLa cells. B) Bar graph of the average mobile fraction comparing MDA-MB-231, HeLa and A549 cells. The calculated mean values were 62.4±4.2% for HeLa (n = 12) and 64.7±4.3% for A549 (n = 10). No statistical differences were found when compared with MDA-MB-231 cells. C) Mean values of the tau exponential values obtained from the recovery curves fitting. MDA-MB-231 cells recovered with a tau value of 4.1±0.6 s, while HeLa cells displayed a tau of 5.5±1.7 s. A549 cells showed the fastest recovery of all, with a tau of 1.9±0.35 s, which was statistically different from the MDA-MB-231 recovery time (p<0.005, Student's t-test).
Figure 3
Figure 3. Non-tumor cells display a lower mobile fraction and slower recovery.
A) Two examples of individual actin recovery curves at the leading edge after photobleaching of GFP-actin from MCF10A (human) and MEF (murine) cells. The recovery of MDA-MB-231 cells is plotted as a red dotted line for comparison. B) Summarized data of the mobile fractions of MEFs (39±4.2%, n = 18) and MCF10A (51.7±1%, n = 6) compared to MDA-MB-231 tumor cells. Each cell type shows statistical differences when compared with the MDA-MB-231 mobile fraction recovery (p<0.005, Student's t-test). The mobile fractions of MCF10A and MEF cells were not statistically different (Student's t-test). C) The recovery times of both MEFs (tau = 7.5±1.6 s) and MCF10A cells (tau = 6.5±0.4 s) were statistically different than that of MDA-MB-231 cells (p<0.005 and p<0.05; Student's t-test).
Figure 4
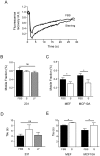
Figure 4. Actin recovery is independent of the presence of extracellular growth factors.
A) Example of fluorescence recovery after FRAP under control conditions (10% FBS, FBS plot) and serum starvation for 16 hours (Starving plot). B) Summary data of the mean mobile fraction in MDA-MB-231 cells. The mean mobile fraction under FBS conditions was 62±5.2% (n = 6), as compared to 58±3% after 16 hours of starvation and 57±2% (n = 6) after PI3K inhibition with LY294002 (n = 6). It should be noted that we have included new control cells, growing in parallel and analyzed on the same day and under the same conditions; therefore, the average mobile fraction has a slightly different value that the overall mean average (70% versus 65%). C) The mobile fraction of non-cancerous cells under serum-starved conditions was reduced to 27±5.2% (n = 10) in mouse fibroblast and to 28±2.4% in MCF10A (n = 6), (p<0.05; Student's t-test). D) Recovery time summary graph. MDA-MB-231 growing in FBS tended to show faster dynamics (4.14±0.6 s) not statistically significant from that of starved cells (6.6±1.7 s). The use of LY294002, a chemical inhibitor of PI3K, did not affect recovery time (4.2±1.0 s). E) In contrast, serum starvation affected the recovery time of non-cancerous cells, increasing the time constant from 8.2±0.2 s to 9.5±0.1 s for MEFs (p<0.05) and 6.5±0.4 s to 8.0±1.2 s for MCF10A cells (p<0.05; Student's t-test).
Figure 5
Figure 5. Increased Profilin I intracellular levels induce cell spreading.
A) MDA-MB-231 control cells (a) and treated with 3 µM of PTD4-PfnI for 24 hours (b). Bottom picture: MDA-MB-231 control cells (red) and cells transfected with GFP-PfnI (green) (c). Notice how transfected cells displayed a large cell size. B) Temporal evolution in cell size of a culture treated with either a chronic application of 1 µM of PTD4-PfnI (every day, n = 430) or a single application of 3 µM (n = 540). C) Summary of the average changes in cell size after treatment with a transduction version of Profilin I (PTD4-PfnI I, 3 µM, n = 230) or after transfection with GFP-PfnI (n = 340). On average cell area was larger when compared with the control MDA-MB-231 cells (p<0.005; Student's t-test). D) Summary of the effects of different transduction proteins: Point mutations of Profilin (H119E and H133S), PTD4-ßGal, PTD4 (a transduction domain without any protein attached) and PTD4-PfnII (the neuronal isoform). None of the treatments altered MDA-MB-231 area (n>100, Student's t-test). Cells were visualized either with the help of Oregon green-Phalloidin or Phalloidin Alexa Fluor-594.
Figure 6
Figure 6. Profilin intracellular levels modify actin treadmilling dynamics.
A) Example of fluorescence recovery in a control MDA-MB-231 cell and after a 24 h treatment with PTD4-PfnI 3 µM. B) Plot summary of the average mobile fraction (left axis) and mean tau (right axis) values before (white box) and after PTD4-PfnI treatment (black box; n = 24). PTD4-PfnI caused a 29% reduction of the mobile fraction from 69±1% to 40±2% and increased the recovery time to a mean value of 8.2±2.2 s (p<0.05 and p<0.005; Student's t-test) C) Example of actin fluorescence recovery in a MDA-MB-231 cell transfected with GFP-PfnI (green) or MembraneCherry-PfnI (red) showing a similar effect to that of PTD4-PfnI treatment. D) Summary plot of the average mobile fraction (left axis) and mean recovery time (right axis). On average, transfection with GFP-PfnI reduced the mobile fraction to a mean value of 50±1.2% (n = 15), while it increased the time course of recovery to a mean value of 9.0±2.2 s. MmbCherry-PfnI expression reduced mobile fraction to 58±3% and slowed recovery time to 8.9±2.2 s (n = 15). (p<0.05 and p<0.005; Student's t-test).
Figure 7
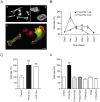
Figure 7. Profilin overexpression reduces cell velocity and directionality.
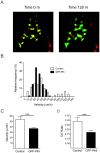
A) GFP-PfnI transfected cells (green) were mixed with control non-transfected MDA-MB-231 cells, and the nuclei were stained with Draq5 nuclear vital dye (red). Cultures were visualized for 8 hours; the images were two examples taken at the beginning of the experiment (time 0 m) and after two hours (120 m). Notice that the same sample contains transfected and non-transfected cells. Fluorescence levels are oversaturated to facilitate visualization. B) Individual cell velocity distribution. GFP-PfnI transfected cells displayed lower velocities (black columns) while control cells displayed a broad distribution (white columns), with a low velocity population (between 10 and 70 µm/h) and a clear second population of faster cells with velocities between 90 and 130 µm/h. C) Plot summaries of the mean velocity. Control cells and GFP-PfnI transfected cells have an average velocity of 53.5±5.5 µm/h and 36. 7±0.3 µm/h, respectively D) Mean values of the D/T ratio comparing control (0.29±0.03) and after GFP-PfnI transfecction (0.17±0.01) (p<0.005; Student's t-test).

Similar articles

Cited by

References

    1. Friedl P, Wolf K (2010) Plasticity of cell migration: a multiscale tuning model. J Cell Biol 188: 11–19. - PMC - PubMed
    1. Schafer DA, Cooper JA (1995) Control of actin assembly at filament ends. Annu Rev Cell Dev Biol 11: 497–518. - PubMed
    1. Pollard TD, Borisy GG (2003) Cellular motility driven by assembly and disassembly of actin filaments. Cell 112(4): 453–465. - PubMed
    1. Haugwitz M, Noegel AA, Karakesisoglou J, Schleicher M (1994) Dictyostelium amoebae that lack G-actin-sequestering profilins show defects in F-actin content, cytokinesis, and development. Cell 79: 303–314. - PubMed
    1. Verheyen EM, Cooley L (1994) Profilin mutations disrupt multiple actin-dependent processes during Drosophila development. Development 120: 717–728. - PubMed

Publication types

LinkOut - more resources