Individual globular domains and domain unfolding visualized in overstretched titin molecules with atomic force microscopy
- PMID: 24465745
- PMCID: PMC3896421
- DOI: 10.1371/journal.pone.0085847
Individual globular domains and domain unfolding visualized in overstretched titin molecules with atomic force microscopy
Abstract
Titin is a giant elastomeric protein responsible for the generation of passive muscle force. Mechanical force unfolds titin's globular domains, but the exact structure of the overstretched titin molecule is not known. Here we analyzed, by using high-resolution atomic force microscopy, the structure of titin molecules overstretched with receding meniscus. The axial contour of the molecules was interrupted by topographical gaps with a mean width of 27.7 nm that corresponds well to the length of an unfolded globular (immunoglobulin and fibronectin) domain. The wide gap-width distribution suggests, however, that additional mechanisms such as partial domain unfolding and the unfolding of neighboring domain multimers may also be present. In the folded regions we resolved globules with an average spacing of 5.9 nm, which is consistent with a titin chain composed globular domains with extended interdomain linker regions. Topographical analysis allowed us to allocate the most distal unfolded titin region to the kinase domain, suggesting that this domain systematically unfolds when the molecule is exposed to overstretching forces. The observations support the prediction that upon the action of stretching forces the N-terminal ß-sheet of the titin kinase unfolds, thus exposing the enzyme's ATP-binding site and hence contributing to the molecule's mechanosensory function.
Conflict of interest statement
Figures


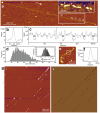
 , where A is frequency maximum, x0 is length offset (1000 nm) and τ is decay constant. d. Examples of titin molecules stretched in the presence of 0.6 M KCl. P indicates the putative PEVK domain.


Similar articles
-
Titin domains progressively unfolded by force are homogenously distributed along the molecule.Biophys J. 2015 Jul 21;109(2):340-5. doi: 10.1016/j.bpj.2015.06.002. Biophys J. 2015. PMID: 26200869 Free PMC article.
-
The mechanical stability of immunoglobulin and fibronectin III domains in the muscle protein titin measured by atomic force microscopy.Biophys J. 1998 Dec;75(6):3008-14. doi: 10.1016/S0006-3495(98)77741-0. Biophys J. 1998. PMID: 9826620 Free PMC article.
-
Force generation by titin folding.Protein Sci. 2017 Jul;26(7):1380-1390. doi: 10.1002/pro.3117. Epub 2017 Mar 1. Protein Sci. 2017. PMID: 28097712 Free PMC article.
-
The Work of Titin Protein Folding as a Major Driver in Muscle Contraction.Annu Rev Physiol. 2018 Feb 10;80:327-351. doi: 10.1146/annurev-physiol-021317-121254. Annu Rev Physiol. 2018. PMID: 29433413 Free PMC article. Review.
-
Titin N2A Domain and Its Interactions at the Sarcomere.Int J Mol Sci. 2021 Jul 15;22(14):7563. doi: 10.3390/ijms22147563. Int J Mol Sci. 2021. PMID: 34299183 Free PMC article. Review.
Cited by
-
Nanosurgical Manipulation of Titin and Its M-Complex.Nanomaterials (Basel). 2022 Jan 6;12(2):178. doi: 10.3390/nano12020178. Nanomaterials (Basel). 2022. PMID: 35055197 Free PMC article.
-
Growing Old Too Early: Skeletal Muscle Single Fiber Biomechanics in Ageing R349P Desmin Knock-in Mice Using the MyoRobot Technology.Int J Mol Sci. 2020 Jul 31;21(15):5501. doi: 10.3390/ijms21155501. Int J Mol Sci. 2020. PMID: 32752098 Free PMC article.
-
Titin domains progressively unfolded by force are homogenously distributed along the molecule.Biophys J. 2015 Jul 21;109(2):340-5. doi: 10.1016/j.bpj.2015.06.002. Biophys J. 2015. PMID: 26200869 Free PMC article.
-
Structural hierarchy of mechanical extensibility in human von Willebrand factor multimers.Protein Sci. 2023 Jan;32(1):e4535. doi: 10.1002/pro.4535. Protein Sci. 2023. PMID: 36478480 Free PMC article.
-
Cryptic Extensibility in von Willebrand Factor Revealed by Molecular Nanodissection.Int J Mol Sci. 2024 Jul 2;25(13):7296. doi: 10.3390/ijms25137296. Int J Mol Sci. 2024. PMID: 39000402 Free PMC article.
References
-
- Wang K (1996) Titin/connectin and nebulin: giant protein rulers of muscle structure and function. Advances In Biophysics 33: 123–134. - PubMed
-
- Maruyama K (1997) Connectin/titin, giant elastic protein of muscle. FASEB J 11: 341–345. - PubMed
-
- Gregorio CC, Granzier H, Sorimachi H, Labeit S (1999) Muscle assembly: a titanic achievement? Curr Opin Cell Biol 11: 18–25. - PubMed
-
- Labeit S, Kolmerer B (1995) Titins: giant proteins in charge of muscle ultrastructure and elasticity. Science 270: 293–296. - PubMed
Publication types
MeSH terms
Substances
LinkOut - more resources
Full Text Sources
Other Literature Sources
Miscellaneous

