

Reliable single cell array CGH for clinical samples
- PMID: 24465780
- PMCID: PMC3897541
- DOI: 10.1371/journal.pone.0085907
Reliable single cell array CGH for clinical samples
Abstract
Background: Disseminated cancer cells (DCCs) and circulating tumor cells (CTCs) are extremely rare, but comprise the precursors cells of distant metastases or therapy resistant cells. The detailed molecular analysis of these cells may help to identify key events of cancer cell dissemination, metastatic colony formation and systemic therapy escape.
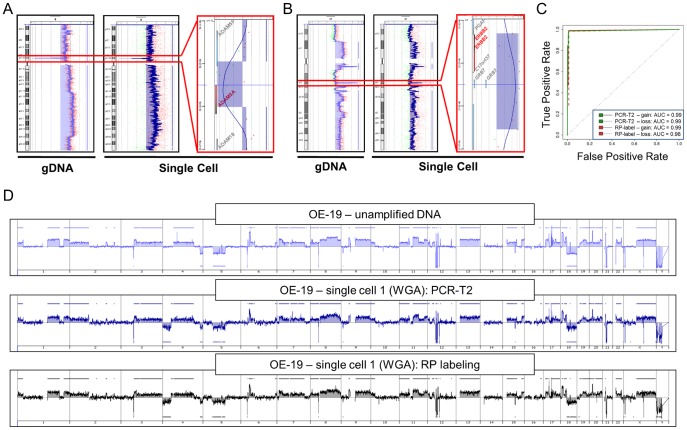
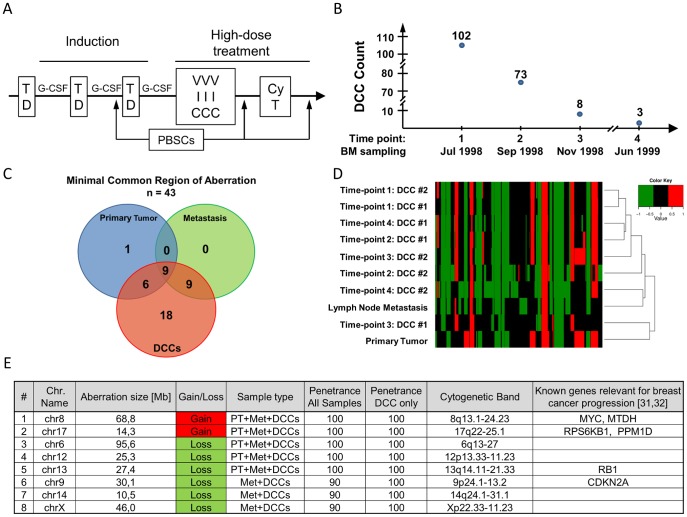
Methodology/principal findings: Using the Ampli1™ whole genome amplification (WGA) technology and high-resolution oligonucleotide aCGH microarrays we optimized conditions for the analysis of structural copy number changes. The protocol presented here enables reliable detection of numerical genomic alterations as small as 0.1 Mb in a single cell. Analysis of single cells from well-characterized cell lines and single normal cells confirmed the stringent quantitative nature of the amplification and hybridization protocol. Importantly, fixation and staining procedures used to detect DCCs showed no significant impact on the outcome of the analysis, proving the clinical usability of our method. In a proof-of-principle study we tracked the chromosomal changes of single DCCs over a full course of high-dose chemotherapy treatment by isolating and analyzing DCCs of an individual breast cancer patient at four different time points.
Conclusions/significance: The protocol enables detailed genome analysis of DCCs and thereby assessment of the clonal evolution during the natural course of the disease and under selection pressures. The results from an exemplary patient provide evidence that DCCs surviving selective therapeutic conditions may be recruited from a pool of genomically less advanced cells, which display a stable subset of specific genomic alterations.
Conflict of interest statement
Figures


Similar articles
-
Array-Based Comparative Genomic Hybridization for the Detection of Copy Number Alterations in Single Cells.Methods Mol Biol. 2024;2752:167-187. doi: 10.1007/978-1-0716-3621-3_11. Methods Mol Biol. 2024. PMID: 38194034
-
The use of ultra-dense array CGH analysis for the discovery of micro-copy number alterations and gene fusions in the cancer genome.BMC Med Genomics. 2011 Jan 27;4:16. doi: 10.1186/1755-8794-4-16. BMC Med Genomics. 2011. PMID: 21272361 Free PMC article.
-
A robust method to analyze copy number alterations of less than 100 kb in single cells using oligonucleotide array CGH.PLoS One. 2013 Jun 25;8(6):e67031. doi: 10.1371/journal.pone.0067031. Print 2013. PLoS One. 2013. PMID: 23825608 Free PMC article.
-
Analysis of Copy-Number Alterations in Single Cells Using Microarray-Based Comparative Genomic Hybridization (aCGH).Curr Protoc Cell Biol. 2014 Dec 1;65:22.19.1-23. doi: 10.1002/0471143030.cb2219s65. Curr Protoc Cell Biol. 2014. PMID: 25447076 Review.
-
Significance of genome-wide analysis of copy number alterations and UPD in myelodysplastic syndromes using combined CGH - SNP arrays.Curr Med Chem. 2012;19(22):3739-47. doi: 10.2174/092986712801661121. Curr Med Chem. 2012. PMID: 22680919 Review.
Cited by
-
Single cell polarity in liquid phase facilitates tumour metastasis.Nat Commun. 2018 Feb 28;9(1):887. doi: 10.1038/s41467-018-03139-6. Nat Commun. 2018. PMID: 29491397 Free PMC article.
-
Genetic alterations driving metastatic colony formation are acquired outside of the primary tumour in melanoma.Nat Commun. 2018 Feb 9;9(1):595. doi: 10.1038/s41467-017-02674-y. Nat Commun. 2018. PMID: 29426936 Free PMC article.
-
Array-Based Comparative Genomic Hybridization for the Detection of Copy Number Alterations in Single Cells.Methods Mol Biol. 2024;2752:167-187. doi: 10.1007/978-1-0716-3621-3_11. Methods Mol Biol. 2024. PMID: 38194034
-
Genomic and expression profiling reveal molecular heterogeneity of disseminated tumor cells in bone marrow of early breast cancer.NPJ Breast Cancer. 2018 Sep 5;4:31. doi: 10.1038/s41523-018-0083-5. eCollection 2018. NPJ Breast Cancer. 2018. PMID: 30211312 Free PMC article.
-
Circulating Tumor Cells from Enumeration to Analysis: Current Challenges and Future Opportunities.Cancers (Basel). 2021 May 31;13(11):2723. doi: 10.3390/cancers13112723. Cancers (Basel). 2021. PMID: 34072844 Free PMC article. Review.
References
-
- Riethdorf S, Wikman H, Pantel K (2008) Review: Biological relevance of disseminated tumor cells in cancer patients. Int J Cancer 123: 1991–2006. - PubMed
-
- Klein CA (2003) The systemic progression of human cancer: a focus on the individual disseminated cancer cell—the unit of selection. Adv Cancer Res 89: 35–67. - PubMed
-
- Cristofanilli M, Hayes DF, Budd GT, Ellis MJ, Stopeck A, et al. (2005) Circulating tumor cells: a novel prognostic factor for newly diagnosed metastatic breast cancer. J Clin Oncol 23: 1420–1430. - PubMed
-
- Cohen SJ, Punt CJ, Iannotti N, Saidman BH, Sabbath KD, et al. (2008) Relationship of circulating tumor cells to tumor response, progression-free survival, and overall survival in patients with metastatic colorectal cancer. J Clin Oncol 26: 3213–3221. - PubMed
-
- Zhang L, Riethdorf S, Wu G, Wang T, Yang K, et al. (2012) Meta-analysis of the prognostic value of circulating tumor cells in breast cancer. Clin Cancer Res 18: 5701–5710. - PubMed
Publication types
MeSH terms
Substances
LinkOut - more resources
Full Text Sources
Other Literature Sources
Molecular Biology Databases
Miscellaneous
