. 2014 Jan 21;9(1):e86078.
doi: 10.1371/journal.pone.0086078. eCollection 2014.

Release of tensile strain on engineered human tendon tissue disturbs cell adhesions, changes matrix architecture, and induces an inflammatory phenotype

Affiliations

Release of tensile strain on engineered human tendon tissue disturbs cell adhesions, changes matrix architecture, and induces an inflammatory phenotype

Monika L Bayer et al. PLoS One. .

Abstract

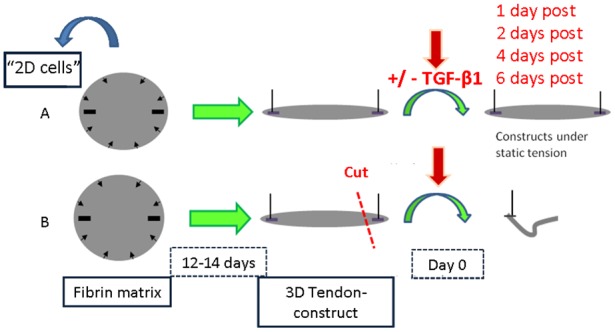
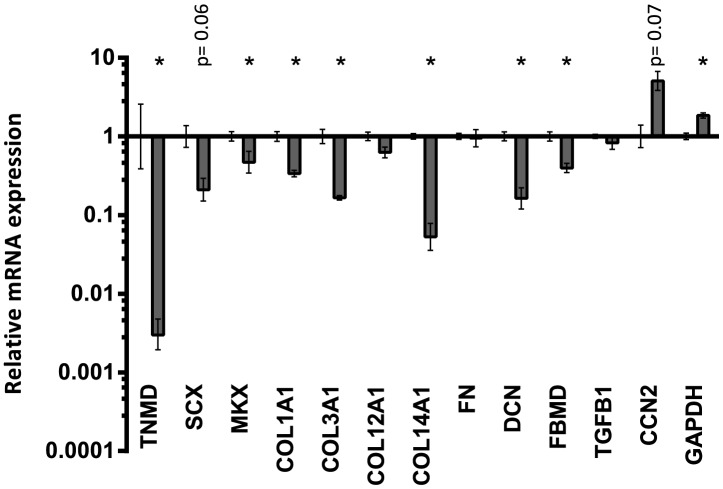
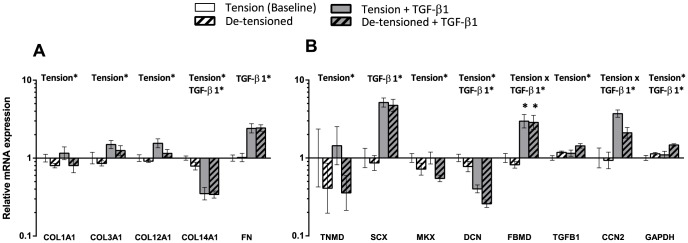
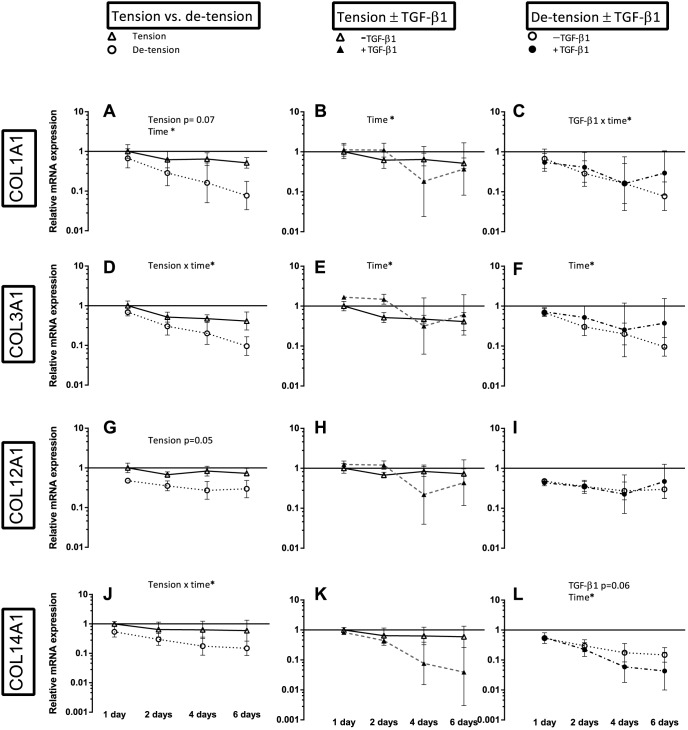
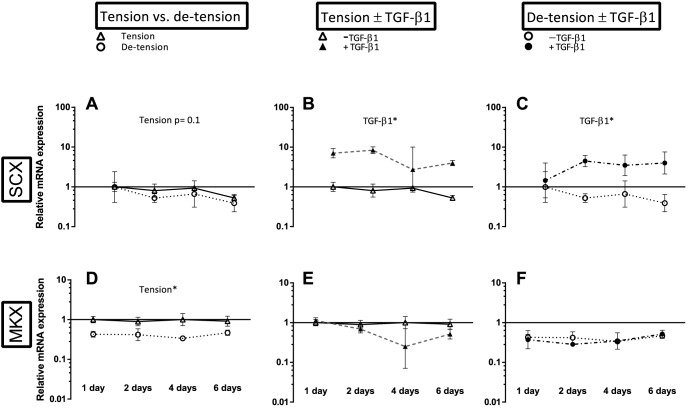
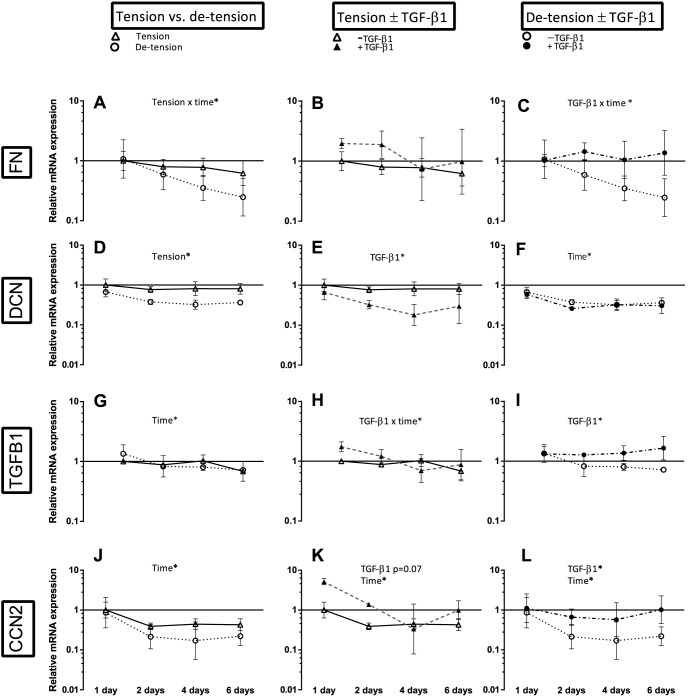
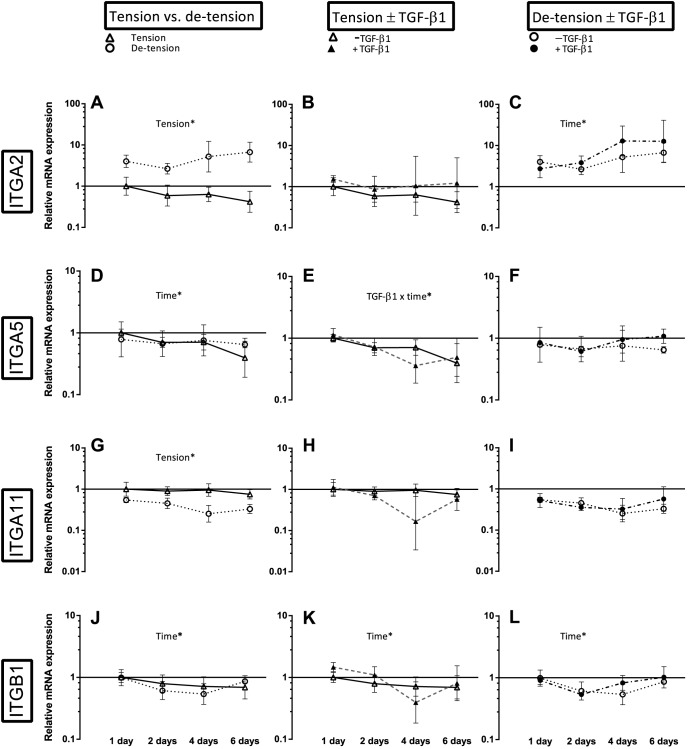
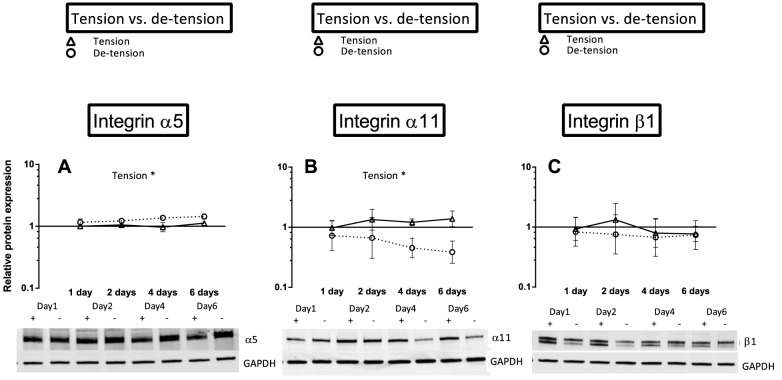
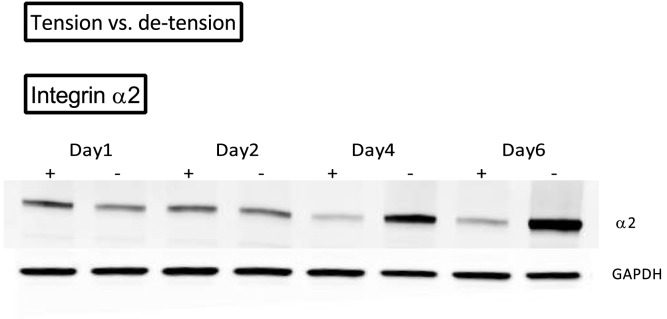
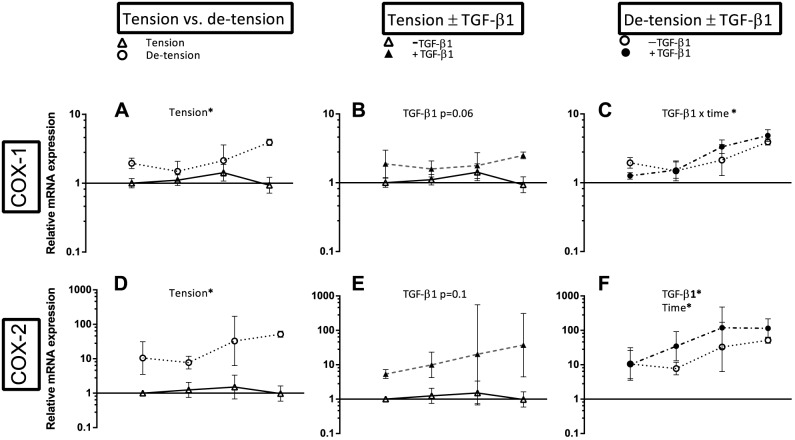
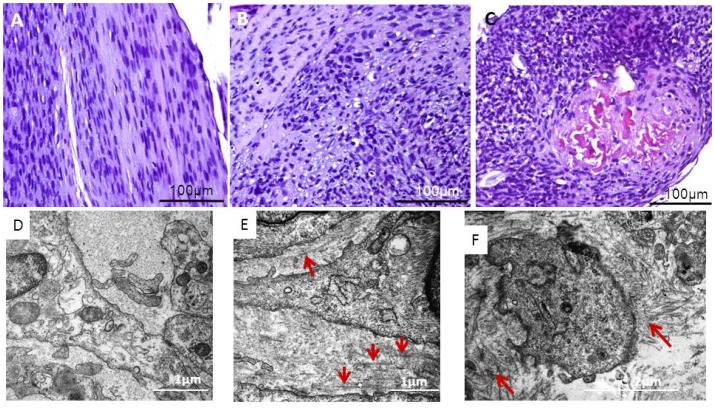
Mechanical loading of tendon cells results in an upregulation of mechanotransduction signaling pathways, cell-matrix adhesion and collagen synthesis, but whether unloading removes these responses is unclear. We investigated the response to tension release, with regard to matrix proteins, pro-inflammatory mediators and tendon phenotypic specific molecules, in an in vitro model where tendon-like tissue was engineered from human tendon cells. Tissue sampling was performed 1, 2, 4 and 6 days after surgical de-tensioning of the tendon construct. When tensile stimulus was removed, integrin type collagen receptors showed a contrasting response with a clear drop in integrin subunit α11 mRNA and protein expression, and an increase in α2 integrin mRNA and protein levels. Further, specific markers for tendon cell differentiation declined and normal tendon architecture was disturbed, whereas pro-inflammatory molecules were upregulated. Stimulation with the cytokine TGF-β1 had distinct effects on some tendon-related genes in both tensioned and de-tensioned tissue. These findings indicate an important role of mechanical loading for cellular and matrix responses in tendon, including that loss of tension leads to a decrease in phenotypical markers for tendon, while expression of pro-inflammatory mediators is induced.


Conflict of interest statement

Competing Interests: The authors have declared that no competing interests exist.

Figures

Figure 1
Figure 1. Overview of study design.
Tendon cells on monolayer (“2D cells”) were harvested prior to seeding tendon cells into fibrin matrix to engineer human tendon-constructs. A) Culture condition under static tension, TGF-β1 supplementation to half of the samples at day 0 defined as the first time point at which a continuous linear matrix between the anchor points was formed; B) Tendon-constructs were cut to release tension at day 0, TGF-β1 supplementation to half of the samples.
Figure 2
Figure 2. Comparison between 2D monolayer and 3D tendon-constructs under static tension.
The 3D tendon-construct is set as baseline, and mRNA expression of tendon cells grown on 2D monolayer is shown relative to the 3D tendon construct. Significant changes are indicated by *. Data presented on a logarithmic y scale baseline as geometric means ± SEM with 3D tendon-construct as baseline (n = 5).
Figure 3
Figure 3. Summary of findings after de-tensioning of 3D tendon-constructs and TGF-β1 supplementation.
The 3D tendon-construct under static tension without TGF-β1 is set as baseline, all other conditions are shown relative to the tensioned 3D tendon-construct (n = 5). A) Analysis of genes encoding for different matrix proteins: Collagen type I (COL1A1), collagen type III (COL3A1), collagen type XII (COL12A1) collagen type XIV (COL14A1) and fibronectin. B) Analysis of tendon phenotypic markers and tendon-related genes: tenomodulin (TNMD), scleraxis (SCX), Mohawk homeobox (MKX), fibromodulin (FBMD), decorin and GAPDH. Data presented on a logarithmic y scale as geometric means ± SEM with 3D tendon construct as baseline (n = 5). Significant 2-way ANOVA (tension*TGF-β1) main effects written above the graphs. For FBMD, * indicates significant effect of TGF-β1 for the individual groups in the post hoc analysis.
Figure 4
Figure 4. Overview over the effect of de-tensioning and TGF-β1 supplementation on mRNA expression of collagen genes.
Left panel (A, D, G, J): Effect of de-tensioning, mid panel (B, E, H, K): Effect of TGF-β1 on tensioned 3D tendon-constructs, right panel (C, F, I, L): Effect of TGF-β1 on de-tensioned 3D tendon-constructs. The data are presented on a logarithmic y scale as geometric means ± SD (n = 3) where Tension Day 1 is baseline. Significant 2-way RM ANOVA (tension*time) or (TGF-β1*time) main effects written above the graphs. Open triangles: 3D tendon-construct under tension, without TGF-β1 supplementation; open circles: 3D tendon-construct de-tensioned, without TGF-β1 supplementation; filled triangles: 3D tendon-construct under tension, with TGF-β1 supplementation; filled circles: 3D tendon-construct de-tensioned, with TGF-β1 supplementation.
Figure 5
Figure 5. Overview over the effect of de-tensioning and TGF-β1 supplementation on mRNA expression of phenotypic markers of tendon lineage.
Left panel (A, D): Effect of de-tensioning, mid panel (B, E): Effect of TGF-β1 on tensioned 3D tendon-constructs, right panel (C, F): Effect of TGF-β1 on de-tensioned 3D tendon-constructs. The data are presented on a logarithmic y scale as geometric means ± SD (n = 3) where Tension Day 1 is baseline. Significant 2-way RM ANOVA (tension*time) or (TGF-β1*time) main effects written above the graphs. Open triangles: 3D tendon-construct under tension, without TGF-β1 supplementation; open circles: 3D tendon-construct de-tensioned, without TGF-β1 supplementation; filled triangles: 3D tendon-construct under tension, with TGF-β1 supplementation; filled circles: 3D tendon-construct de-tensioned, with TGF-β1 supplementation.
Figure 6
Figure 6. Overview over the effect of de-tensioning and TGF-β1 supplementation on mRNA expression of tendon matrix genes and growth factors.
Left panel (A, D, G, J): Effect of de-tensioning, mid panel (B, E, H, K): Effect of TGF-β1 on tensioned 3D tendon-constructs, right panel (C, F, I, L): Effect of TGF-β1 on de-tensioned 3D tendon-constructs. The data are presented on a logarithmic y scale as geometric means ± SD (n = 3) where Tension Day 1 is baseline. Significant 2-way RM ANOVA (tension*time) or (TGF-β1*time) main effects written above the graphs. Open triangles: 3D tendon-construct under tension, without TGF-β1 supplementation; open circles: 3D tendon-construct de-tensioned, without TGF-β1 supplementation; filled triangles: 3D tendon-construct under tension, with TGF-β1 supplementation; filled circles: 3D tendon-construct de-tensioned, with TGF-β1 supplementation.
Figure 7
Figure 7. Overview over the effect of de-tensioning and TGF-β1 supplementation on mRNA expression of different integrin subunits.
Left panel (A, D, G, J): Effect of de-tensioning, mid panel (B, E, H, K): Effect of TGF-β1 on tensioned 3D tendon-constructs, right panel (C, F, I, L): Effect of TGF-β1 on de-tensioned 3D tendon-constructs. The data are presented on a logarithmic y scale as geometric means ± SD (n = 3) where Tension Day 1 is baseline. Significant 2-way RM ANOVA (tension*time) or (TGF-β1*time) main effects written above the graphs. Integrin α2 (ITGA2); Integrin α5 (ITGA5); Integrin α11 (ITGA11); Integrin β1 (ITGB1). Open triangles: 3D tendon-construct under tension, without TGF-β1 supplementation; open circles: 3D tendon-construct de-tensioned, without TGF-β1 supplementation; filled triangles: 3D tendon-construct under tension, with TGF-β1 supplementation; filled circles: 3D tendon-construct de-tensioned, with TGF-β1 supplementation.
Figure 8
Figure 8. Overview over the effect of de-tensioning on protein expression of different integrin subunits.
A) Effect of de-tensioning on integrin sub-unit α5, B) Effect of de-tensioning on integrin sub-unit α11, C) Effect of de-tensioning on integrin sub-unit β1. The data are presented on a logarithmic y scale as geometric means ± SD (n = 3) where Tension Day 1 is baseline. Significant 2-way RM ANOVA (tension*time) main effects written above the graphs. Open triangles: 3D tendon-construct under tension, without TGF-β1 supplementation; open circles: 3D tendon-construct de-tensioned, without TGF-β1 supplementation. Below the graphs, representative western blots are shown (+/- tension).
Figure 9
Figure 9. Overview over the effect of de-tensioning on protein expression of integrin subunit α2.
The figure shows the western blot of one 3D tendon-construct over four time points shown(+/- tension).
Figure 10
Figure 10. Overview over the effect of de-tensioning and TGF-β1 supplementation on mRNA expression of pro-inflammatory mediators.
Left panel (A, D): Effect of de-tensioning, mid panel (B, E): Effect of TGF-β1 on tensioned 3D tendon-constructs, right panel (C, F): Effect of TGF-β1 on de-tensioned 3D tendon-constructs. The data are presented on a logarithmic y scale as geometric means ± SD (n = 3) where Tension Day 1 is baseline. Significant 2-way RM ANOVA (tension*time) or (TGF-β1*time) main effects written above the graphs. Open triangles: 3D tendon-construct under tension, without TGF-β1 supplementation; open circles: 3D tendon-construct de-tensioned, without TGF-β1 supplementation; filled triangles: 3D tendon-construct under tension, with TGF-β1 supplementation; filled circles: 3D tendon-construct de-tensioned, with TGF-β1 supplementation.
Figure 11
Figure 11. Visualizing of morphological changes to de-tensioning.
A) H&E staining of 3D tendon-construct harvested 24 hours under static tension. (B) 3D tendon-construct harvested 24 hours after the release of tension, (C) 3D tendon-construct harvested six days after the release of tension. D) Electron micrograph of cross-sectioned 3D tendon-construct harvested after 48 hours under static tension. The extracellular space shows regularly organized collagen fibrils. (E) 3D tendon-construct harvested 48 hours after release of tension: Besides the presence of aligned collagen fibrils, disorganized collagen fibrils become apparent (red arrows). (F) 3D tendon-construct harvested 48 hours after release of tension: Extracellular space with disorganized collagen fibrils in close proximity to tendon cells (red arrows).

Similar articles

Cited by

References

    1. Giddings VL, Beaupre GS, Whalen RT, Carter DR (2000) Calcaneal loading during walking and running. Med Sci Sports Exerc 32: 627–634. - PubMed
    1. Herchenhan A, Bayer ML, Svensson RB, Magnusson SP, Kjaer M (2013) In vitro tendon tissue development from human fibroblasts demonstrates collagen fibril diameter growth associated with a rise in mechanical strength. Dev Dyn 242: 2–8. - PubMed
    1. Stanley RL, Fleck RA, Becker DL, Goodship AE, Ralphs JR, et al. (2007) Gap junction protein expression and cellularity: comparison of immature and adult equine digital tendons. J Anat 211: 325–334. - PMC - PubMed
    1. Couppe C, Kongsgaard M, Aagaard P, Hansen P, Bojsen-Moller J, et al. (2008) Habitual loading results in tendon hypertrophy and increased stiffness of the human patellar tendon. J Appl Physiol 105: 805–810. - PubMed
    1. Eliasson P, Andersson T, Aspenberg P (2012) Achilles tendon healing in rats is improved by intermittent mechanical loading during the inflammatory phase. J Orthop Res 30: 274–279. - PubMed

Publication types

MeSH terms

LinkOut - more resources