

Molecular dynamics simulation of the allosteric regulation of eIF4A protein from the open to closed state, induced by ATP and RNA substrates
- PMID: 24465900
- PMCID: PMC3900488
- DOI: 10.1371/journal.pone.0086104
Molecular dynamics simulation of the allosteric regulation of eIF4A protein from the open to closed state, induced by ATP and RNA substrates
Abstract
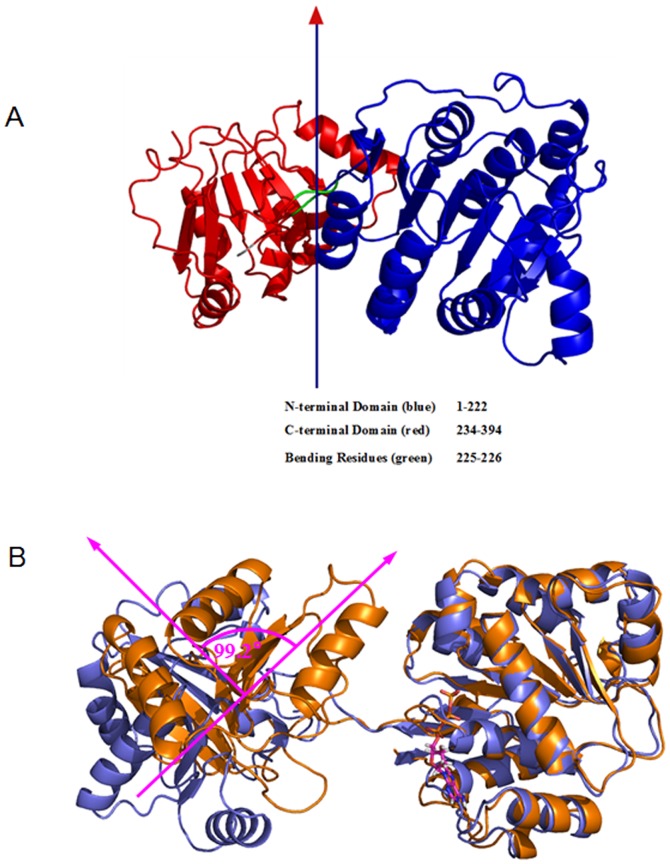
Background: Eukaryotic initiation factor 4A (eIF4A) plays a key role in the process of protein translation initiation by facilitating the melting of the 5' proximal secondary structure of eukaryotic mRNA for ribosomal subunit attachment. It was experimentally postulated that the closed conformation of the eIF4A protein bound by the ATP and RNA substrates is coupled to RNA duplex unwinding to promote protein translation initiation, rather than an open conformation in the absence of ATP and RNA substrates. However, the allosteric process of eIF4A from the open to closed state induced by the ATP and RNA substrates are not yet fully understood.
Methodology: In the present work, we constructed a series of diplex and ternary models of the eIF4A protein bound by the ATP and RNA substrates to carry out molecular dynamics simulations, free energy calculations and conformation analysis and explore the allosteric properties of eIF4A.
Results: The results showed that the eIF4A protein completes the conformational transition from the open to closed state via two allosteric processes of ATP binding followed by RNA and vice versa. Based on cooperative allosteric network analysis, the ATP binding to the eIF4A protein mainly caused the relative rotation of two domains, while the RNA binding caused the proximity of two domains via the migration of RNA bases in the presence of ATP. The cooperative binding of ATP and RNA for the eIF4A protein plays a key role in the allosteric transition.
Conflict of interest statement
Figures


Similar articles
-
eIF4B, eIF4G and RNA regulate eIF4A activity in translation initiation by modulating the eIF4A conformational cycle.Nucleic Acids Res. 2014 Jul;42(12):7911-22. doi: 10.1093/nar/gku440. Epub 2014 May 21. Nucleic Acids Res. 2014. PMID: 24848014 Free PMC article.
-
eIF4B and eIF4G jointly stimulate eIF4A ATPase and unwinding activities by modulation of the eIF4A conformational cycle.J Mol Biol. 2014 Jan 9;426(1):51-61. doi: 10.1016/j.jmb.2013.09.027. Epub 2013 Sep 27. J Mol Biol. 2014. PMID: 24080224
-
Human translation initiation factor eIF4G1 possesses a low-affinity ATP binding site facing the ATP-binding cleft of eIF4A in the eIF4G/eIF4A complex.Biochemistry. 2014 Oct 21;53(41):6422-5. doi: 10.1021/bi500600m. Epub 2014 Oct 8. Biochemistry. 2014. PMID: 25255371 Free PMC article.
-
The DEAD-box helicase eIF4A: paradigm or the odd one out?RNA Biol. 2013 Jan;10(1):19-32. doi: 10.4161/rna.21966. Epub 2012 Sep 20. RNA Biol. 2013. PMID: 22995829 Free PMC article. Review.
-
From unwinding to clamping - the DEAD box RNA helicase family.Nat Rev Mol Cell Biol. 2011 Jul 22;12(8):505-16. doi: 10.1038/nrm3154. Nat Rev Mol Cell Biol. 2011. PMID: 21779027 Review.
Cited by
-
Creating novel translation inhibitors to target pro-survival proteins in chronic lymphocytic leukemia.Leukemia. 2019 Jul;33(7):1663-1674. doi: 10.1038/s41375-018-0364-x. Epub 2019 Jan 30. Leukemia. 2019. PMID: 30700841 Free PMC article.
-
eIF4F: a retrospective.J Biol Chem. 2015 Oct 2;290(40):24091-9. doi: 10.1074/jbc.R115.675280. Epub 2015 Aug 31. J Biol Chem. 2015. PMID: 26324716 Free PMC article. Review.
-
Molecular Dynamics Simulations Identify Tractable Lead-like Phenyl-Piperazine Scaffolds as eIF4A1 ATP-competitive Inhibitors.ACS Omega. 2021 Sep 15;6(38):24432-24443. doi: 10.1021/acsomega.1c02805. eCollection 2021 Sep 28. ACS Omega. 2021. PMID: 34604625 Free PMC article.
-
Molecular dynamics simulation unveils the conformational flexibility of the interdomain linker in the bacterial transcriptional regulator GabR from Bacillus subtilis bound to pyridoxal 5'-phosphate.PLoS One. 2017 Dec 18;12(12):e0189270. doi: 10.1371/journal.pone.0189270. eCollection 2017. PLoS One. 2017. PMID: 29253008 Free PMC article.
-
Mechanism of cytoplasmic mRNA translation.Arabidopsis Book. 2015 Apr 24;13:e0176. doi: 10.1199/tab.0176. eCollection 2015. Arabidopsis Book. 2015. PMID: 26019692 Free PMC article.
References
-
- Duncan R, Milburn SC, Hershey JW (1987) Regulated phosphorylation and low abundance of HeLa cell initiation factor eIF-4F suggest a role in translational control. Heat shock effects on eIF-4F. J Biol Chem 262: 380–388. - PubMed
-
- Spirin AS (2009) How does a scanning ribosomal particle move along the 5′-untranslated region of eukaryotic mRNA? Brownian Ratchet model. Biochemistry 48: 10688–10692. - PubMed
-
- Gingras A-C, Raught B, Sonenberg N (1999) eIF4 initiation factors: effectors of mRNA recruitment to ribosomes and regulators of translation. Annu Rev Biochem 68: 913–963. - PubMed
Publication types
MeSH terms
Substances
Associated data
- Actions
- Actions
- Actions
- Actions
- Actions
- Actions
- Actions
- Actions
- Actions
LinkOut - more resources
Full Text Sources
Other Literature Sources
Molecular Biology Databases
Miscellaneous
