

Role of mitochondria in parvovirus pathology
- PMID: 24465910
- PMCID: PMC3897641
- DOI: 10.1371/journal.pone.0086124
Role of mitochondria in parvovirus pathology
Abstract
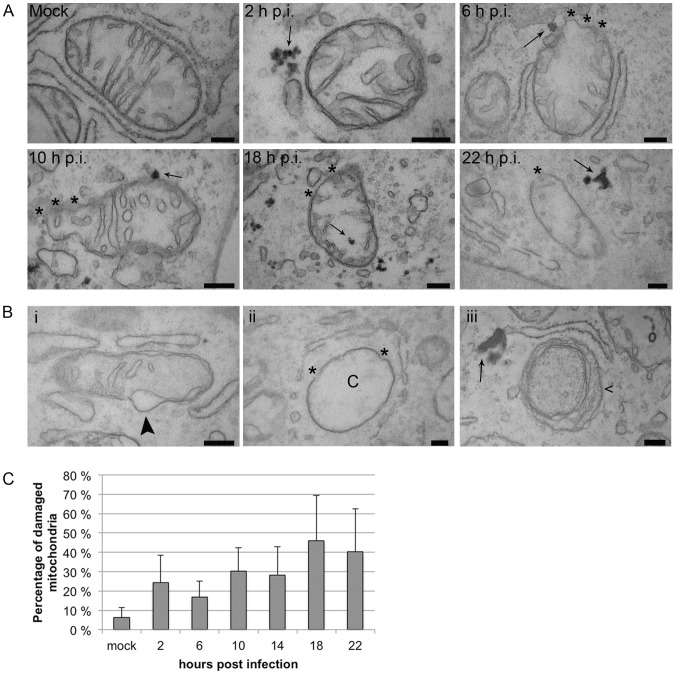
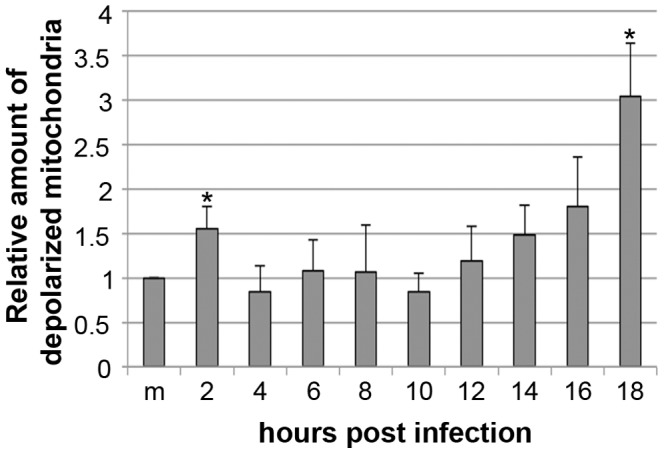
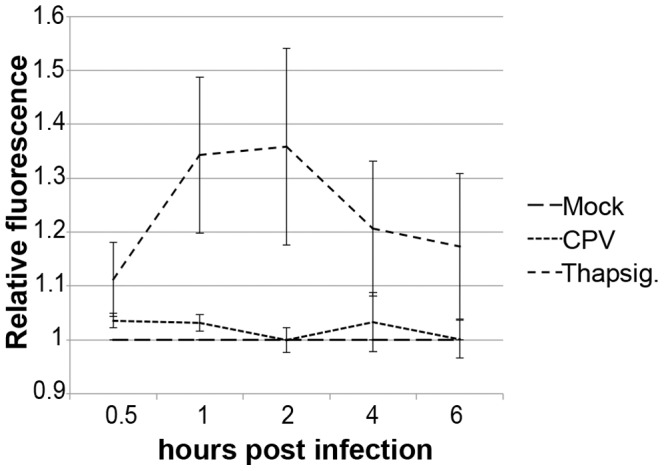
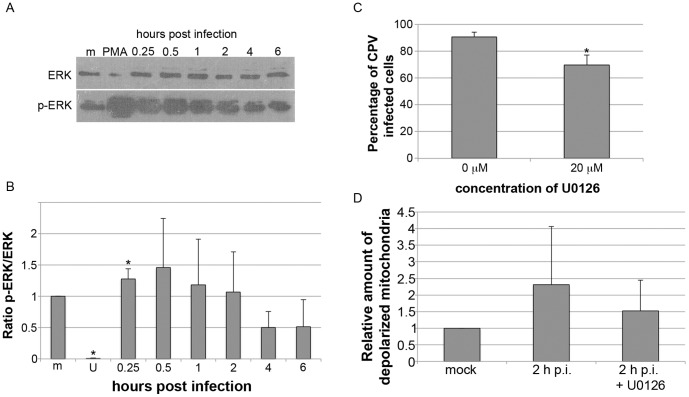
Proper functioning of the mitochondria is crucial for the survival of the cell. Viruses are able to interfere with mitochondrial functions as they infect the host cell. Parvoviruses are known to induce apoptosis in infected cells, but the role of the mitochondria in parvovirus induced cytopathy is only partially known. Here we demonstrate with confocal and electron microscopy that canine parvovirus (CPV) associated with the mitochondrial outer membrane from the onset of infection. During viral entry a transient depolarization of the mitochondrial transmembrane potential and increase in ROS level was detected. Subsequently, mitochondrial homeostasis was normalized shortly, as detected by repolarization of the mitochondrial membrane and decrease of ROS. Indeed, activation of cell survival signalling through ERK1/2 cascade was observed early in CPV infected cells. At 12 hours post infection, concurrent with the expression of viral non-structural protein 1, damage to the mitochondrial structure and depolarization of its membrane were apparent. Results of this study provide additional insight of parvovirus pathology and also more general information of virus-mitochondria association.
Conflict of interest statement
Figures


Similar articles
-
Carnivore Parvovirus Ecology in the Serengeti Ecosystem: Vaccine Strains Circulating and New Host Species Identified.J Virol. 2019 Jun 14;93(13):e02220-18. doi: 10.1128/JVI.02220-18. Print 2019 Jul 1. J Virol. 2019. PMID: 30996096 Free PMC article.
-
Evolution of canine parvovirus involved loss and gain of feline host range.Virology. 1996 Jan 15;215(2):186-9. doi: 10.1006/viro.1996.0021. Virology. 1996. PMID: 8560765
-
Canine parvovirus in asymptomatic feline carriers.Vet Microbiol. 2012 May 25;157(1-2):78-85. doi: 10.1016/j.vetmic.2011.12.024. Epub 2011 Dec 24. Vet Microbiol. 2012. PMID: 22257775
-
Parvovirus infection in domestic companion animals.Vet Clin North Am Small Anim Pract. 2008 Jul;38(4):837-50, viii-ix. doi: 10.1016/j.cvsm.2008.03.008. Vet Clin North Am Small Anim Pract. 2008. PMID: 18501282 Review.
-
Canine parvovirus: the worldwide occurrence of antigenic variants.J Gen Virol. 2016 Sep;97(9):2043-2057. doi: 10.1099/jgv.0.000540. Epub 2016 Jul 7. J Gen Virol. 2016. PMID: 27389721 Review.
Cited by
-
Conserved regulation of neurodevelopmental processes and behavior by FoxP in Drosophila.PLoS One. 2019 Feb 12;14(2):e0211652. doi: 10.1371/journal.pone.0211652. eCollection 2019. PLoS One. 2019. PMID: 30753188 Free PMC article.
-
Canine Parvovirus and Its Non-Structural Gene 1 as Oncolytic Agents: Mechanism of Action and Induction of Anti-Tumor Immune Response.Front Oncol. 2021 May 3;11:648873. doi: 10.3389/fonc.2021.648873. eCollection 2021. Front Oncol. 2021. PMID: 34012915 Free PMC article. Review.
-
Viral Nonstructural Protein 1 Induces Mitochondrion-Mediated Apoptosis in Mink Enteritis Virus Infection.J Virol. 2019 Oct 29;93(22):e01249-19. doi: 10.1128/JVI.01249-19. Print 2019 Nov 15. J Virol. 2019. PMID: 31484746 Free PMC article.
-
N-Acetylcysteine and Its Immunomodulatory Properties in Humans and Domesticated Animals.Antioxidants (Basel). 2023 Oct 16;12(10):1867. doi: 10.3390/antiox12101867. Antioxidants (Basel). 2023. PMID: 37891946 Free PMC article. Review.
-
Altered mitochondrial dynamics as a consequence of Venezuelan Equine encephalitis virus infection.Virulence. 2017 Nov 17;8(8):1849-1866. doi: 10.1080/21505594.2016.1276690. Epub 2017 Jan 25. Virulence. 2017. PMID: 28075229 Free PMC article.
References
-
- Rasola A, Bernardi P (2007) The mitochondrial permeability transition pore and its involvement in cell death and in disease pathogenesis. Apoptosis 12: 815–833. - PubMed
-
- Galluzzi L, Kepp O, Kroemer G (2012) Mitochondria: master regulators of danger signalling. Nat Rev Mol Cell Biol 13: 780–788. - PubMed
-
- Seth RB, Sun L, Ea CK, Chen ZJ (2005) Identification and characterization of MAVS, a mitochondrial antiviral signaling protein that activates NF-kappaB and IRF 3. Cell 122: 669–682. - PubMed
-
- Huttemann M, Lee I, Pecinova A, Pecina P, Przyklenk K, et al. (2008) Regulation of oxidative phosphorylation, the mitochondrial membrane potential, and their role in human disease. J Bioenerg Biomembr 40: 445–456. - PubMed
MeSH terms
Substances
LinkOut - more resources
Full Text Sources
Other Literature Sources
Research Materials
Miscellaneous
