

Spatial distribution of excitatory synapses on the dendrites of ganglion cells in the mouse retina
- PMID: 24465934
- PMCID: PMC3895034
- DOI: 10.1371/journal.pone.0086159
Spatial distribution of excitatory synapses on the dendrites of ganglion cells in the mouse retina
Abstract
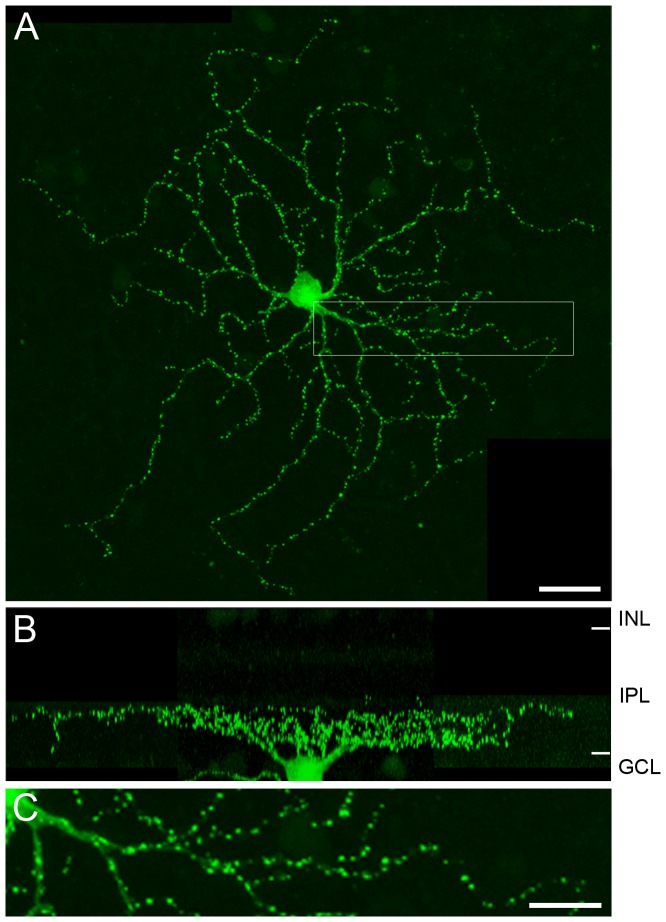
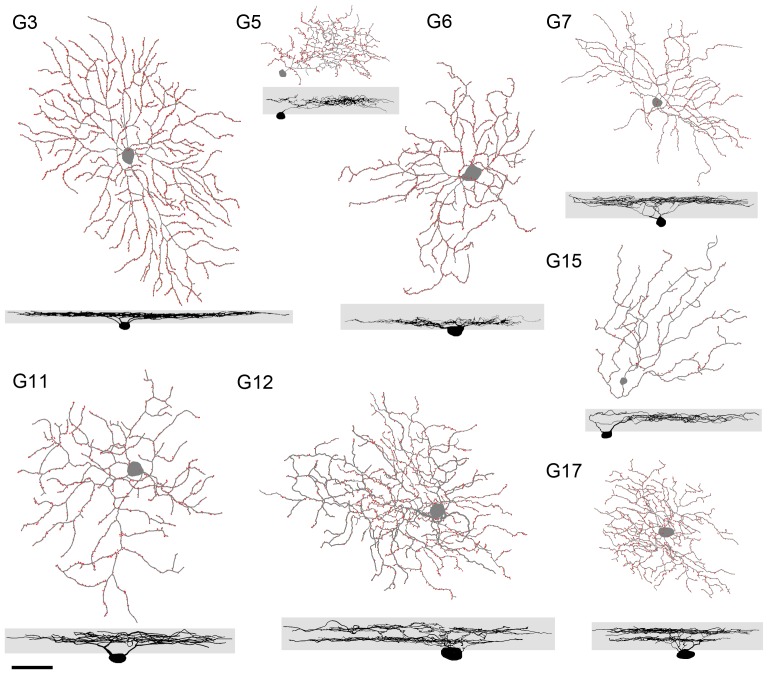
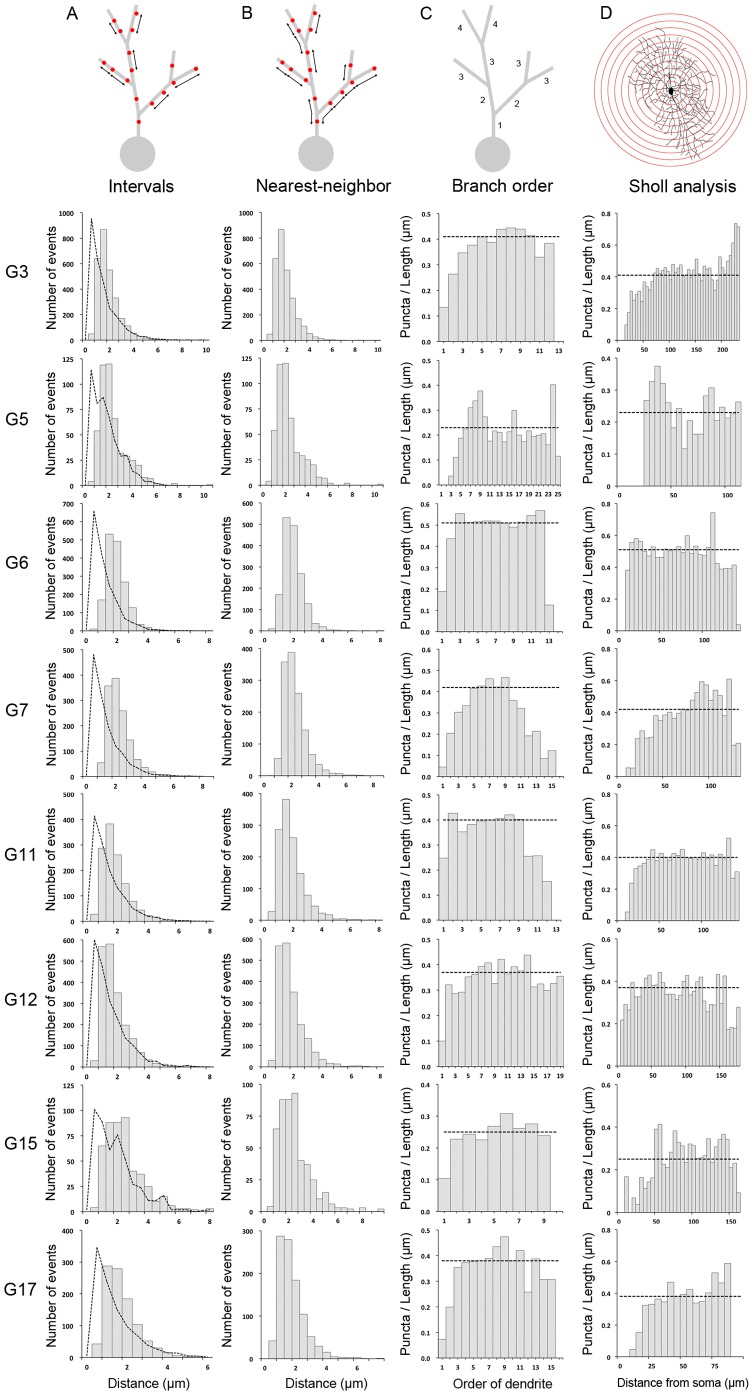
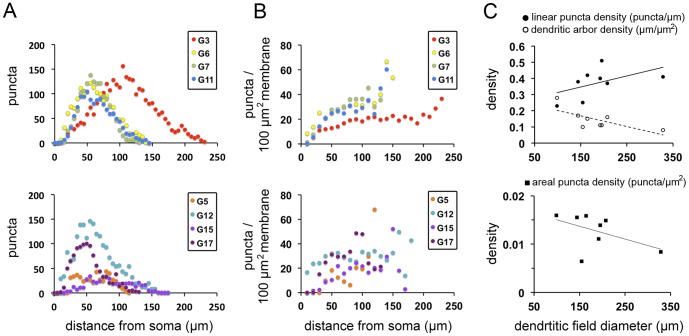
Excitatory glutamatergic inputs from bipolar cells affect the physiological properties of ganglion cells in the mammalian retina. The spatial distribution of these excitatory synapses on the dendrites of retinal ganglion cells thus may shape their distinct functions. To visualize the spatial pattern of excitatory glutamatergic input into the ganglion cells in the mouse retina, particle-mediated gene transfer of plasmids expressing postsynaptic density 95-green fluorescent fusion protein (PSD95-GFP) was used to label the excitatory synapses. Despite wide variation in the size and morphology of the retinal ganglion cells, the expression of PSD95 puncta was found to follow two general rules. Firstly, the PSD95 puncta are regularly spaced, at 1-2 µm intervals, along the dendrites, whereby the presence of an excitatory synapse creates an exclusion zone that rules out the presence of other glutamatergic synaptic inputs. Secondly, the spatial distribution of PSD95 puncta on the dendrites of diverse retinal ganglion cells are similar in that the number of excitatory synapses appears to be less on primary dendrites and to increase to a plateau on higher branch order dendrites. These observations suggest that synaptogenesis is spatially regulated along the dendritic segments and that the number of synaptic contacts is relatively constant beyond the primary dendrites. Interestingly, we also found that the linear puncta density is slightly higher in large cells than in small cells. This may suggest that retinal ganglion cells with a large dendritic field tend to show an increased connectivity of excitatory synapses that makes up for their reduced dendrite density. Mapping the spatial distribution pattern of the excitatory synapses on retinal ganglion cells thus provides explicit structural information that is essential for our understanding of how excitatory glutamatergic inputs shape neuronal responses.
Conflict of interest statement
Figures
Similar articles
-
The spatial distribution of glutamatergic inputs to dendrites of retinal ganglion cells.J Comp Neurol. 2008 Sep 10;510(2):221-36. doi: 10.1002/cne.21795. J Comp Neurol. 2008. PMID: 18623177 Free PMC article.
-
Developmental patterning of glutamatergic synapses onto retinal ganglion cells.Neural Dev. 2008 Mar 26;3:8. doi: 10.1186/1749-8104-3-8. Neural Dev. 2008. PMID: 18366789 Free PMC article.
-
Spatial relationships between GABAergic and glutamatergic synapses on the dendrites of distinct types of mouse retinal ganglion cells across development.PLoS One. 2013 Jul 26;8(7):e69612. doi: 10.1371/journal.pone.0069612. Print 2013. PLoS One. 2013. PMID: 23922756 Free PMC article.
-
Distinct synaptic mechanisms create parallel S-ON and S-OFF color opponent pathways in the primate retina.Vis Neurosci. 2014 Mar;31(2):139-51. doi: 10.1017/S0952523813000230. Epub 2013 Jul 29. Vis Neurosci. 2014. PMID: 23895762 Free PMC article. Review.
-
Synapse diversity and synaptome architecture in human genetic disorders.Hum Mol Genet. 2019 Nov 21;28(R2):R219-R225. doi: 10.1093/hmg/ddz178. Hum Mol Genet. 2019. PMID: 31348488 Free PMC article. Review.
Cited by
-
Small GTPase RIT1 in Mouse Retina; Cellular and Functional Analysis.Curr Eye Res. 2018 Sep;43(9):1160-1168. doi: 10.1080/02713683.2018.1482557. Epub 2018 Jun 25. Curr Eye Res. 2018. PMID: 29843527 Free PMC article.
-
Cellular and Molecular Analysis of Dendritic Morphogenesis in a Retinal Cell Type That Senses Color Contrast and Ventral Motion.J Neurosci. 2017 Dec 13;37(50):12247-12262. doi: 10.1523/JNEUROSCI.2098-17.2017. Epub 2017 Nov 7. J Neurosci. 2017. PMID: 29114073 Free PMC article.
-
Color and cellular selectivity of retinal ganglion cell subtypes through frequency modulation of electrical stimulation.Sci Rep. 2021 Mar 4;11(1):5177. doi: 10.1038/s41598-021-84437-w. Sci Rep. 2021. PMID: 33664347 Free PMC article.
-
Synapse Loss and Dendrite Remodeling in a Mouse Model of Glaucoma.PLoS One. 2015 Dec 4;10(12):e0144341. doi: 10.1371/journal.pone.0144341. eCollection 2015. PLoS One. 2015. PMID: 26637126 Free PMC article.
-
Targeted Stimulation of Retinal Ganglion Cells in Epiretinal Prostheses: A Multiscale Computational Study.IEEE Trans Neural Syst Rehabil Eng. 2020 Nov;28(11):2548-2556. doi: 10.1109/TNSRE.2020.3027560. Epub 2020 Nov 6. IEEE Trans Neural Syst Rehabil Eng. 2020. PMID: 32991284 Free PMC article.
References
-
- Sterling P (1983) Microcircuitry of the cat retina. Annu Rev Neurosci 6: 149–185. - PubMed
Publication types
MeSH terms
Substances
LinkOut - more resources
Full Text Sources
Other Literature Sources
Molecular Biology Databases
Miscellaneous
