

Effects of varying degrees of intermittent hypoxia on proinflammatory cytokines and adipokines in rats and 3T3-L1 adipocytes
- PMID: 24466027
- PMCID: PMC3897671
- DOI: 10.1371/journal.pone.0086326
Effects of varying degrees of intermittent hypoxia on proinflammatory cytokines and adipokines in rats and 3T3-L1 adipocytes
Abstract
Objectives: Intermittent hypoxia (IH), resulted from recurring episodes of upper airway obstruction, is the hallmark feature and the most important pathophysiologic pathway of obstructive sleep apnea (OSA). IH is believed to be the most important factor causing systemic inflammation. Studies suggest that insulin resistance (IR) is positively associated with OSA. In this study, we hypothesized that the recurrence of IH might result in cellular and systemic inflammation, which was manifested through the levels of proinflammatory cytokines and adipokines after IH exposure, and because IR is linked with inflammation tightly, this inflammatory situation may implicate an IR status.
Methods: We developed an IH 3T3-L1 adipocyte and rat model respectively, recapitulating the nocturnal oxygen profile in OSA. In IH cells, nuclear factor kappa B (NF-κB) DNA binding reactions, hypoxia-inducible factor-1α (HIF-1α), glucose transporter-1 (Glut-1), necrosis factor alpha (TNF-α), interleukin (IL) -6, leptin, adiponectin mRNA transcriptional activities and protein expressions were measured. In IH rats, blood glucose, insulin, TNF-α, IL-6, leptin and adiponectin levels were analyzed.
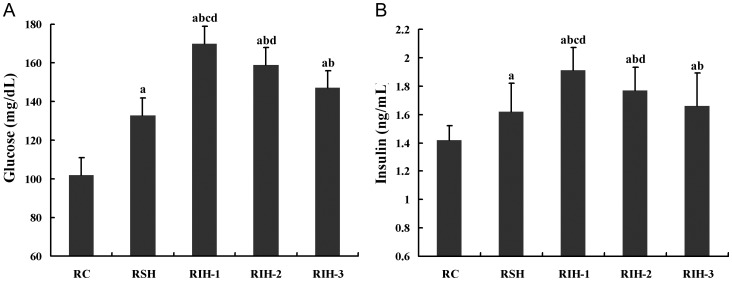
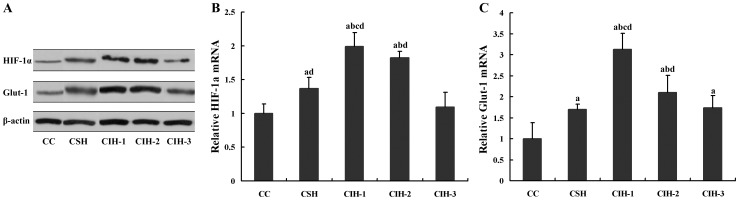
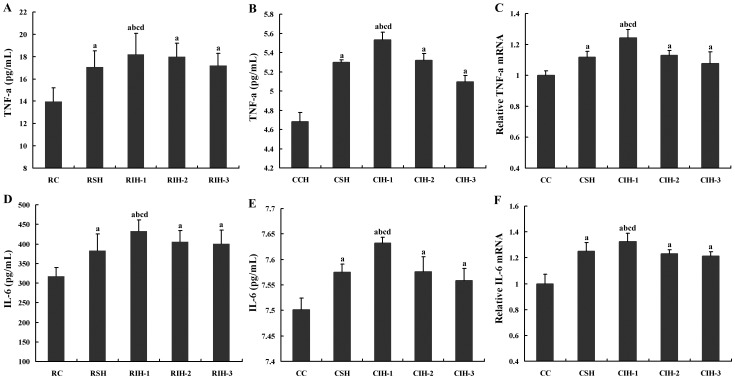
Results: The insulin and blood glucose levels in rats and NF-κB DNA binding activities in cells had significantly statistical results described as severe IH>moderate IH>mild IH>sustained hypoxia>control. The mRNA and protein levels of HIF-1α and Glut-1 in severe IH group were the highest. In cellular and animal models, both the mRNA and protein levels of TNF-α, IL-6 and leptin were the highest in severe IH group, when the lowest in severe IH group for adiponectin.
Conclusions: Oxidative stress and the release of pro-inflammatory cytokines/adipokines, which are the systemic inflammatory markers, are associated with IH closely and are proportional to the severity of IH. Because IR and glucose intolerance are linked with inflammation tightly, our results may implicate the clinical relationships between OSA and IR.
Conflict of interest statement
Figures


References
-
- Feng J, Chen BY (2009) Prevalence and incidence of hypertension in obstructive sleep apnea patients and the relationship between obstructive sleep apnea and its confounders. Chin Med J (Engl) 122: 1464–1468. - PubMed
-
- Young T, Peppard PE, Gottlieb DJ (2002) Epidemiology of obstructive sleep apnea: a population health perspective. Am J Respir Crit Care Med 165: 1217–1239. - PubMed
-
- National Heart, Lung, and Blood Institute Working Group on Sleep Apnea (1996) Sleep apnea: is your patient at risk? Am Fam Physician 53: 247–253. - PubMed
-
- Lavie L (2009) Oxidative stress–a unifying paradigm in obstructive sleep apnea and comorbidities. Prog Cardiovasc Dis. 51: 303–312. - PubMed
Publication types
MeSH terms
Substances
LinkOut - more resources
Full Text Sources
Other Literature Sources
Miscellaneous
