

Molecular and cellular characterization of the tomato pollen profilin, LePro1
- PMID: 24466125
- PMCID: PMC3897733
- DOI: 10.1371/journal.pone.0086505
Molecular and cellular characterization of the tomato pollen profilin, LePro1
Abstract
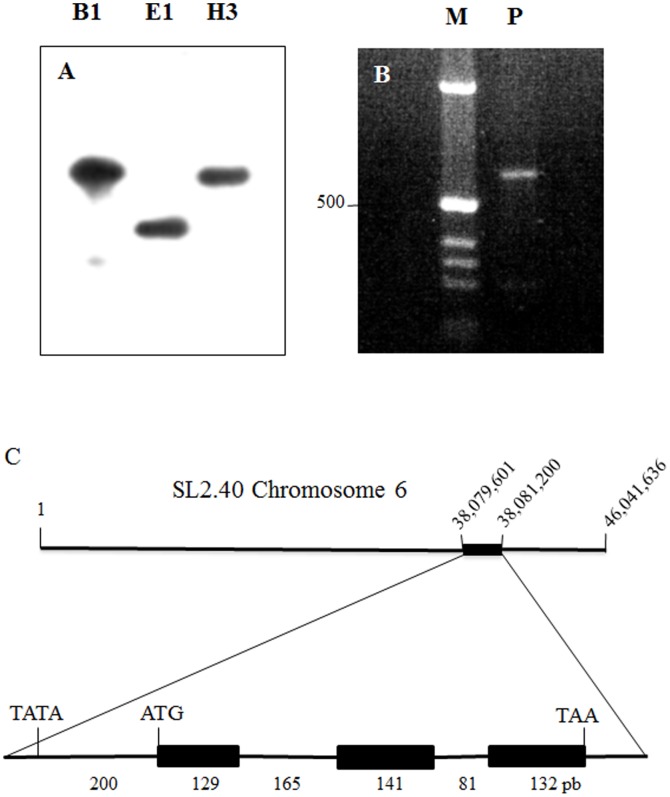
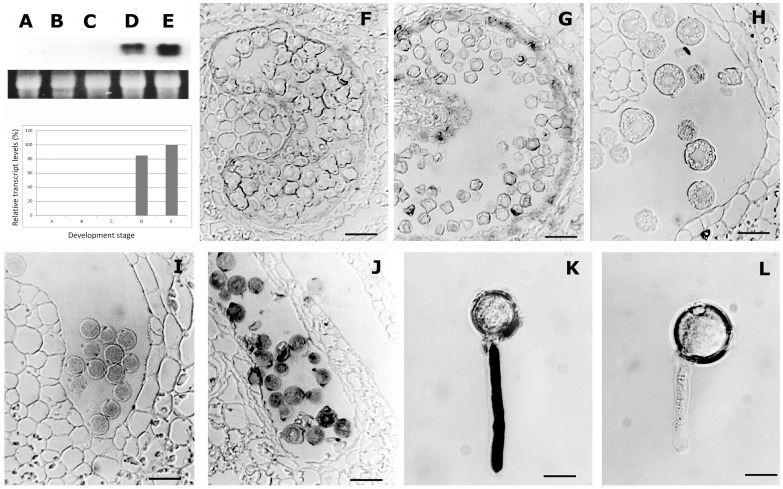
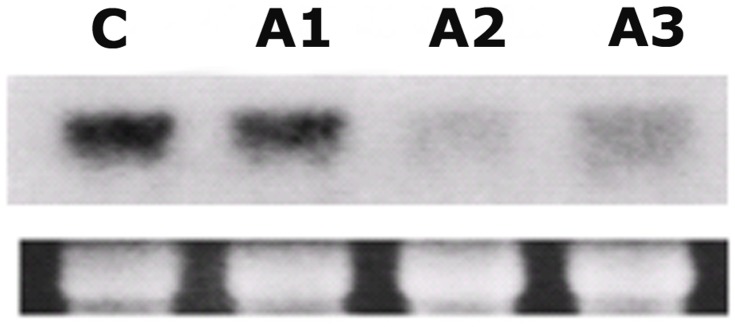
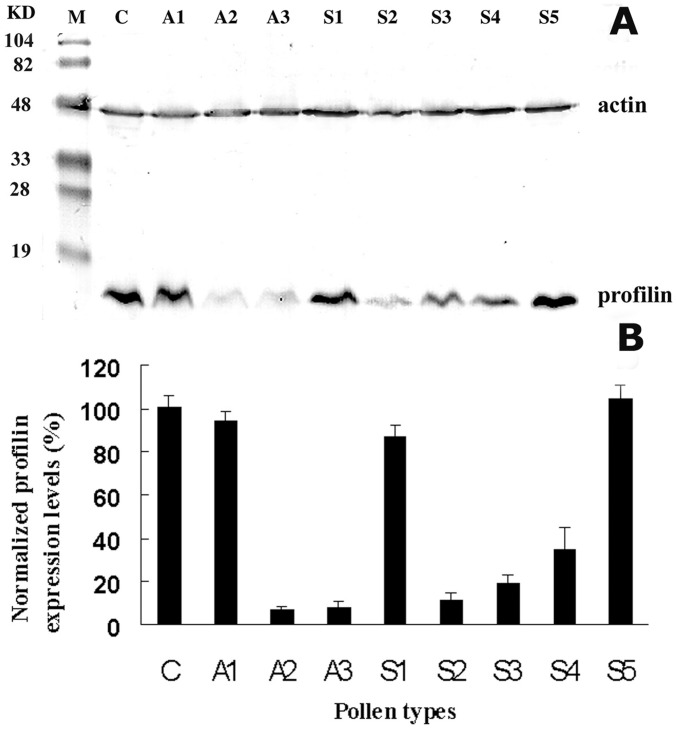
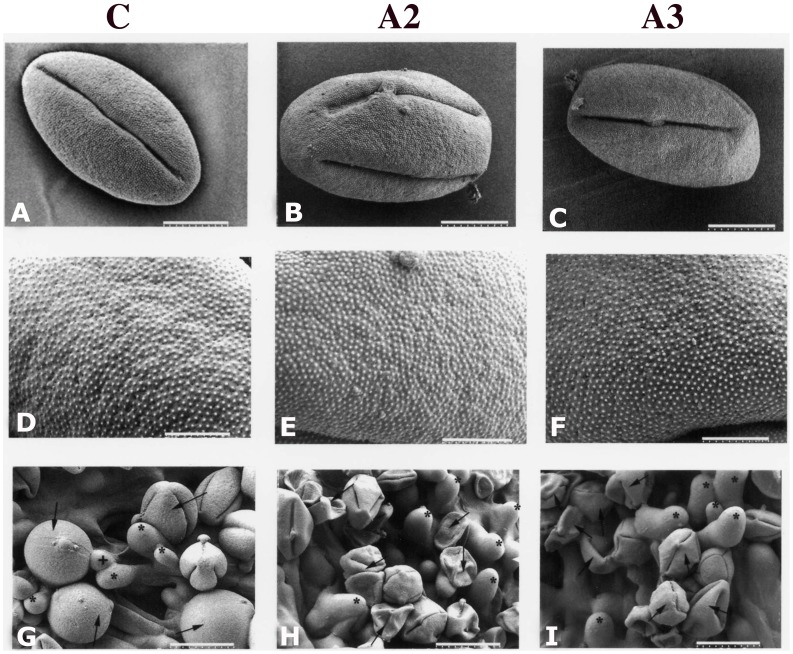
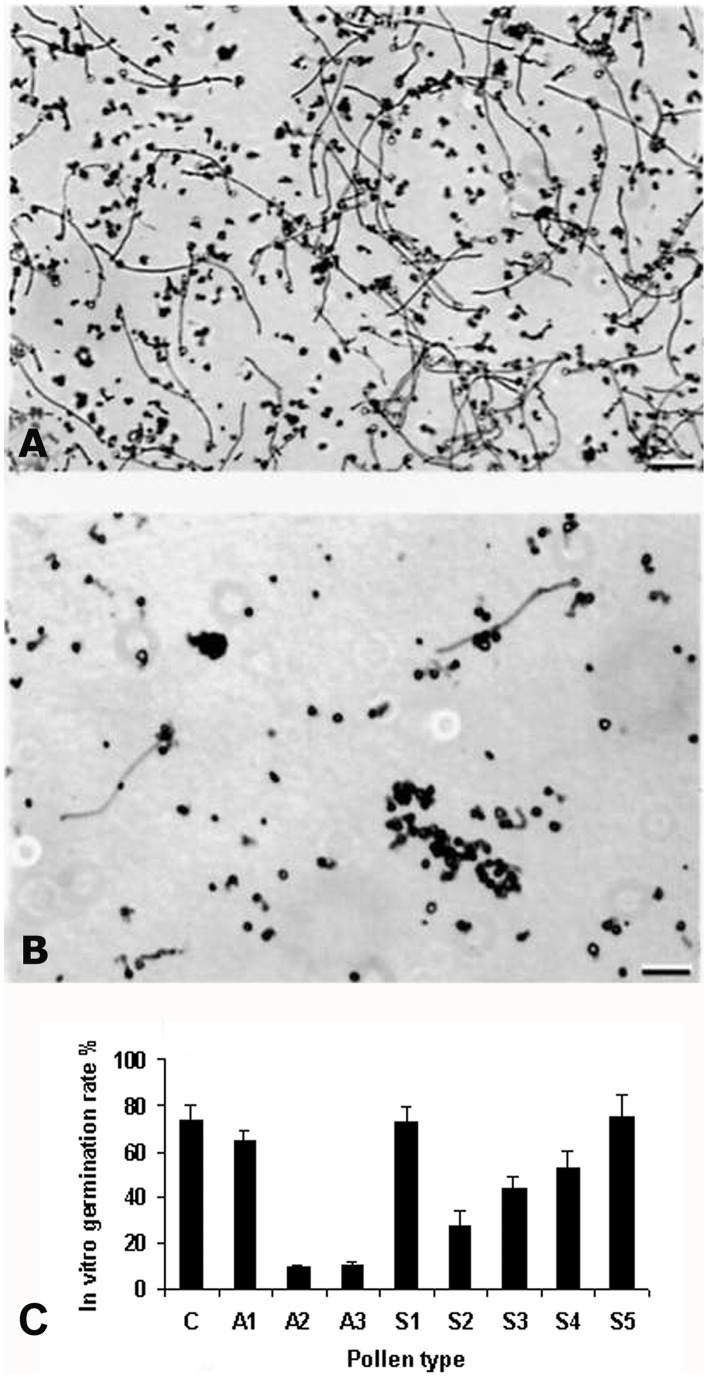
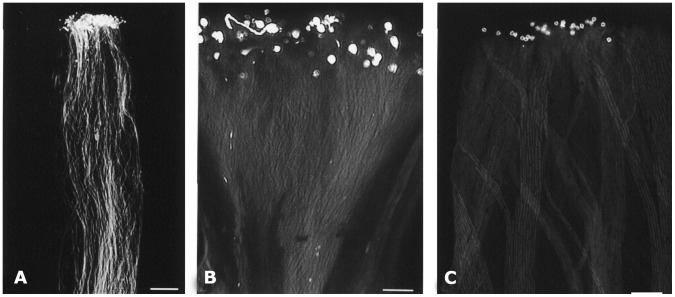
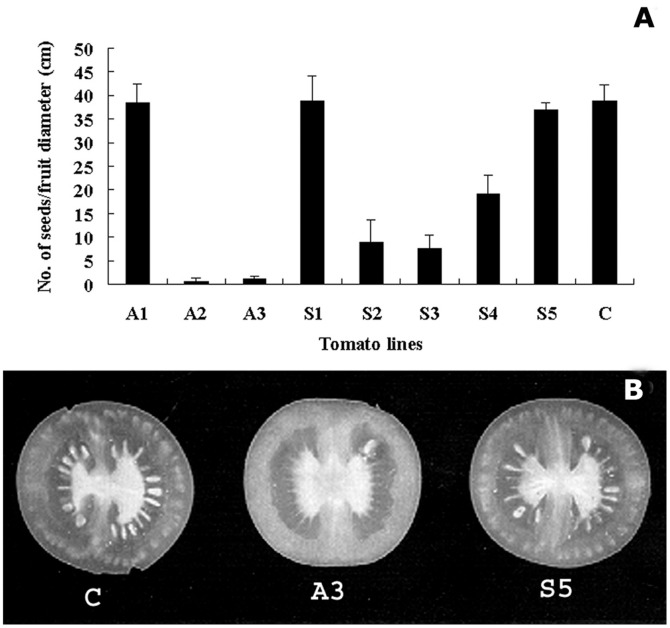
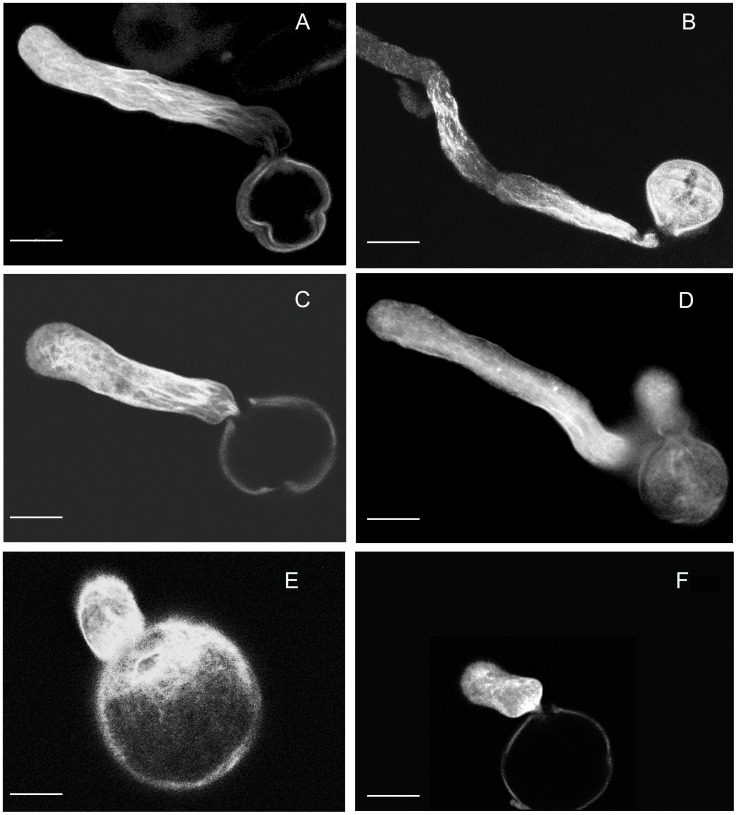
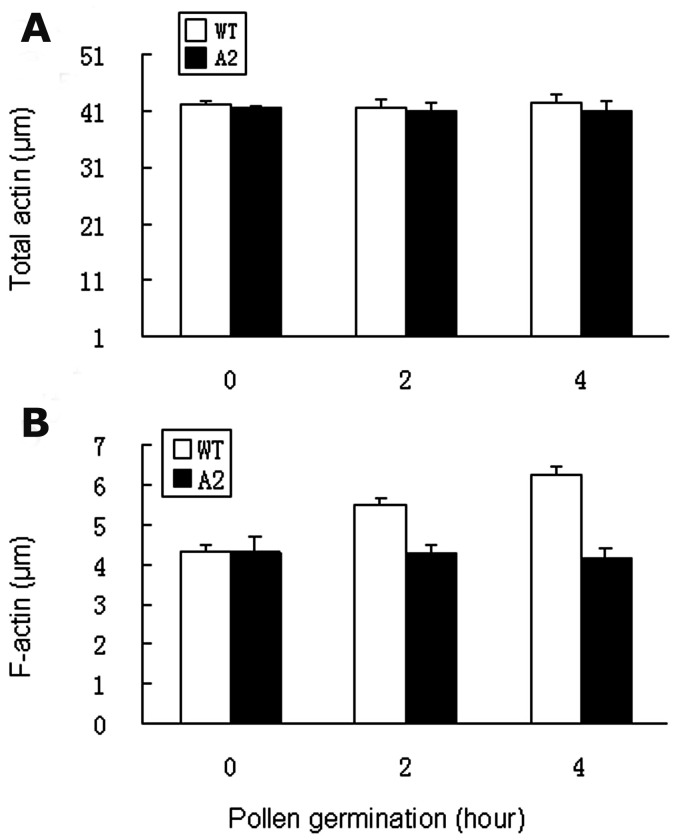
Profilin is an actin-binding protein involved in the dynamic turnover and restructuring of the actin cytoskeleton in all eukaryotic cells. We previously cloned a profilin gene, designated as LePro1 from tomato pollen. To understand its biological role, in the present study, we investigated the temporal and spatial expression of LePro1 during pollen development and found that the transcript was only detected at late stages during microsporogenesis and pollen maturation. Using antisense RNA, we successfully knocked down the expression of LePro1 in tomato plants using stable transformation, and obtained two antisense lines, A2 and A3 showing significant down-regulation of LePro1 in pollen resulting in poor pollen germination and abnormal pollen tube growth. A disorganized F-actin distribution was observed in the antisense pollen. Down-regulation of LePro1 also appeared to affect hydration of pollen deposited on the stigma and arrested pollen tube elongation in the style, thereby affecting fertilization. Our results suggest that LePro1 in conjunction with perhaps other cytoskeletal proteins, plays a regulatory role in the proper organization of F-actin in tomato pollen tubes through promoting actin assembly. Down-regulation of LePro1 leads to interruption of actin assembly and disorganization of the actin cytoskeleton thus arresting pollen tube growth. Based on the present and previous studies, it is likely that a single transcript of profilin gives rise to multiple forms displaying multifunctionality in tomato pollen.
Conflict of interest statement
Figures
Similar articles
-
Profilin Regulates Apical Actin Polymerization to Control Polarized Pollen Tube Growth.Mol Plant. 2015 Dec 7;8(12):1694-709. doi: 10.1016/j.molp.2015.09.013. Epub 2015 Oct 1. Mol Plant. 2015. PMID: 26433093
-
Molecular cloning and mRNA localization of tomato pollen profilin.Plant Mol Biol. 1998 Mar;36(5):699-707. doi: 10.1023/a:1005971327353. Plant Mol Biol. 1998. PMID: 9526502
-
Profilin inhibits pollen tube growth through actin-binding, but not poly-L-proline-binding.Planta. 2004 Apr;218(6):906-15. doi: 10.1007/s00425-003-1174-5. Epub 2004 Jan 8. Planta. 2004. PMID: 14712393
-
Actin Bundles in The Pollen Tube.Int J Mol Sci. 2018 Nov 22;19(12):3710. doi: 10.3390/ijms19123710. Int J Mol Sci. 2018. PMID: 30469514 Free PMC article. Review.
-
Regulation of actin dynamics in pollen tubes: control of actin polymer level.J Integr Plant Biol. 2009 Aug;51(8):740-50. doi: 10.1111/j.1744-7909.2009.00850.x. J Integr Plant Biol. 2009. PMID: 19686371 Review.
Cited by
-
RhoA/mDia-1/profilin-1 signaling targets microvascular endothelial dysfunction in diabetic retinopathy.Graefes Arch Clin Exp Ophthalmol. 2015 May;253(5):669-80. doi: 10.1007/s00417-015-2985-3. Epub 2015 Mar 20. Graefes Arch Clin Exp Ophthalmol. 2015. PMID: 25791356 Review.
-
Functional Disruption of the Tomato Putative Ortholog of HAWAIIAN SKIRT Results in Facultative Parthenocarpy, Reduced Fertility and Leaf Morphological Defects.Front Plant Sci. 2019 Oct 14;10:1234. doi: 10.3389/fpls.2019.01234. eCollection 2019. Front Plant Sci. 2019. PMID: 31681360 Free PMC article.
-
Tomato Allergy: The Characterization of the Selected Allergens and Antioxidants of Tomato (Solanum lycopersicum)-A Review.Antioxidants (Basel). 2022 Mar 28;11(4):644. doi: 10.3390/antiox11040644. Antioxidants (Basel). 2022. PMID: 35453329 Free PMC article. Review.
-
Developmental and quantitative expression profile of the six pollen allergens of mugwort (Artemisia vulgaris L.).BMC Plant Biol. 2025 Jul 2;25(1):805. doi: 10.1186/s12870-025-06917-9. BMC Plant Biol. 2025. PMID: 40604475 Free PMC article.
References
-
- Parthasarathy MV, Perdue AM, Witzum AW, Alvernaz J (1985) Actin network as a normal component of the cytoskeleton in many vascular plant cells. Am J Bot 72: 1318–1323.
-
- Staiger CJ, Schliwa M (1987) Actin localization and function in higher plants. Protoplasma 141: 1–12.
-
- Seagull RW (1989) The plant cytoskeleton CRC Crit Rev Plant Sci. 8: 131–167.
-
- Aderem A (1992) Signal transduction and the actin cytoskeleton: the roles of MARCKS and profilin. Trends Biochem Sci 17: 438–443. - PubMed
-
- Taylor LP, Hepler PK (1997) Pollen germination and tube growth. Annu Rev Plant Physiol Plant Mol Biol 48: 461–491. - PubMed
Publication types
MeSH terms
Substances
LinkOut - more resources
Full Text Sources
Other Literature Sources
