. 2014 Jan 23;9(1):e86671.
doi: 10.1371/journal.pone.0086671. eCollection 2014.

CD9 negatively regulates CD26 expression and inhibits CD26-mediated enhancement of invasive potential of malignant mesothelioma cells

Affiliations

CD9 negatively regulates CD26 expression and inhibits CD26-mediated enhancement of invasive potential of malignant mesothelioma cells

Toshihiro Okamoto et al. PLoS One. .

Abstract

CD26/dipeptidyl peptidase IV is a cell surface glycoprotein which consists of multiple functional domains beside its ectopeptidase site. A growing body of evidence indicates that elevated expression of CD26 correlates with disease aggressiveness and invasive potential of selected malignancies. To further explore the molecular mechanisms involved in this clinical behavior, our current work focused on the interaction between CD26 and CD9, which were recently identified as novel markers for cancer stem cells in malignant mesothelioma. We found that CD26 and CD9 co-modulated and co-precipitated with each other in the malignant mesothelioma cell lines ACC-MESO1 and MSTO-211H. SiRNA study revealed that depletion of CD26 led to increased CD9 expression, while depletion of CD9 resulted in increased CD26 expression. Consistent with these findings was the fact that gene transfer of CD26 into CD26-negative MSTO-211H cells reduced CD9 expression. Cell invasion assay showed that overexpression of CD26 or gene depletion of CD9 led to enhanced invasiveness, while CD26 gene depletion resulted in reduced invasive potential. Furthermore, our work suggested that this enhanced invasiveness may be partly mediated by α5β1 integrin, since co-precipitation studies demonstrated an association between CD26 and α5β1 integrin. Finally, gene depletion of CD9 resulted in elevated protein levels and tyrosine phosphorylation of FAK and Cas-L, which are downstream of β1 integrin, while depletion of CD26 led to a reduction in the levels of these molecules. Collectively, our findings suggest that CD26 potentiates tumor cell invasion through its interaction with α5β1 integrin, and CD9 negatively regulates tumor cell invasion by reducing the level of CD26-α5β1 integrin complex through an inverse correlation between CD9 and CD26 expression. Our results also suggest that CD26 and CD9 serve as potential biomarkers as well as promising molecular targets for novel therapeutic approaches in malignant mesothelioma and other malignancies.


Conflict of interest statement

Competing Interests: C. Morimoto is a patent holder of humanized CD26 monoclonal antibody (name of patent: Anti-CD26 antibodies and Methods of use thereof. Number of patent: US Patent # 7402698). Y's therapeutics,Inc owns this patent and C. Morimoto is one of founders of this company. C. Morimoto declares that this does not alter the authors' adherence to all PLOS ONE policies on sharing data and materials as detailed online in the guide for authors.

Figures

Figure 1.
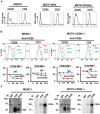
Figure 1.. CD26 associates with CD9.
(A). Flow cytometric analysis of CD26 and CD9 expression on MESO1, MSTO-Wild or MSTO-CD26 (+) cells. (B). MESO1 or MSTO-CD26 (+) cells were incubated up to 72 h at 37 °C with either control IgG (10 µg/ml) or humanized anti-CD26 mAb (10 µg/ml). These cells were stained with anti-CD26-FITC (5K76) or with anti-CD9-FITC, and subjected to flow cytometry. Intensity of modulation was indicated by mean fluorescence intensity (MFI). (C). MESO1 or MSTO-CD26 (+) cells were subjected to immunoprecipitation with control IgG, humanized anti-CD26 mAb, and anti-CD9 mAb (5H9). Immunoblot was conducted with anti-CD26 polyclonal antibody, and anti-CD9 mAb (5H9). These results were also confirmed by 5 separate experiments.
Figure 2
Figure 2. CD26 associates with CD9 in an inverse manner.
(A). Heat map representing color-coded expression levels of differentially expressed genes. CD26/Depletion: control siRNA- and CD26 siRNA-transfectedMESO1. CD26/Over expression: MSTO-Wild and MSTO-CD26 (+) cells. Upregulated (red) or downregulated (green). (B and C). MESO1 transfectants of control siRNA, CD26 siRNA, and CD9 siRNA, or MSTO-Wild and MSTO-CD26 (+) cells were stained with anti-CD26-FITC or anti-CD9-FITC and subjected to flow cytometry. (D). MESO1 transfectants with control siRNA, CD26 siRNA, and CD9 siRNA, or MSTO-Wild and MSTO-CD26 (+) cells were lysed and probed with anti-CD26 polyclonal antibody, anti-CD9 mAb (5H9) and anti-β-actin polyclonal antibody. (E). RT-PCR was carried out for analysis of CD26 and CD9 gene expressions on MESO1 transfectants with controlsiRNA, CD26siRNA, and CD9siRNA, or on MSTO-Wild and MSTO-CD26 (+) cells. GAPDH amplification was used as internal control. These results were also confirmed by 5 separate experiments.
Figure 3
Figure 3. CD26 potentiates tumor cell invasion.
(A). Flow cytometric analysis of CD26 and CD9 expressions in MESO1. (B). Sorting of CD26CD9+ cells and CD26+CD9+ cells, and immunoprecipitation was performed with humanized anti-CD26 mAb and anti-CD9 mAb (5H9), then probed with anti-CD26 polyclonal antibody and anti-CD9 mAb (5H9). (C and E).Tumor cell invasion was measured with the Boyden chamber-based cell invasion assay for 24 h. Number of invaded cells was represented as means ± SE (n = 5).*p<0.01, **p<0.001. (D). Flow cytometric analysis of CD26 and CD9 expressions in MESO1 and sorting of CD26+CD9+ cells and CD26+CD9 cells. These results were also confirmed by 3 separate experiments.
Figure 4
Figure 4. CD9 negatively regulates CD26-mediated invasion.
(A-E).Cells were analyzed by the cell invasion assay for 24 h. Number of invaded cells were represented as means ± SE (n = 5). (A). MSTO-Wild,MSTO-CD26 (+), and MESO1 cells. Invaded cells stained are shown in the top panel. **p<0.005. (B). MSTO-CD26 (+) or MESO1 cells transfected with controlsiRNA or CD26siRNA. **p<0.005, ***p<0.001. (C). MSTO-Wild,MSTO-CD26 (+), and MESO1 cells transfected with control-siRNA or CD9siRNA. Invaded cells stained are shown in the right panel. **p<0.005, ***p<0.001. (D). MSTO-Wild, MSTO-CD26 (+), and MESO1 cells treated with control IgG or anti-CD9 mAb (10 µg/ml).**p<0.005, ***p<0.001. (E). NCI-H226 was transfected with pMX vector control or pMX-CD9. After staining with CD26-FITC and CD9-FITC, cells were subjected to flow cytometry.Boyden chamber-based cell invasion assay was performed with NCI-H226 transfected with pMX vector control or pMX-CD9 for 24 h. Number of invaded cells/well was represented as means ± SE (n = 5).*p<0.05.
Figure 5
Figure 5. CD26 potentiates invasiveness through α5β1 integrin.
(A).MSTO-Wild, MSTO-CD26 (+) cells were subjected to flow cytometry for CD26, α5, and β1. (B). MESO1 and MSTO-CD26 (+) cells were subjected to immunoprecipitation with control IgG, humanized anti-CD26 mAb, anti-CD9 mAb (5H9), anti-α5 mAb (2H6), or anti-β1 mAb (4B4). The immunoblot was probed with anti-CD26 polyclonal antibody, anti-CD9 mAb (5H9), anti-α5 mAb (2H6), or anti-β1 mAb (4B4). (C). Boyden chamber-based cell invasion assay of MESO1 and MSTO-CD26 (+) cells treated with anti-α5, and β1 antibodies for 24 h. (n = 5). *p<0.01, **p<0.005. (D).The cell migration assay of MESO1 and MSTO-CD26 (+) cells treated with anti-α5, and β1 antibodies.(n = 5). *p<0.05, **p<0.01.
Figure 6
Figure 6. Downregulation of CD9 enhances CD26-mediated invasive potential.
(A). MESO1 and MSTO-CD26 (+) cells transfected with control siRNA and CD26-siRNA were subjected to immunoblotting using anti-α5 (2H6), anti-β1 (4B4) mAbs, anti-CD26 polyclonal antibody, anti-β-actin polyclonal antibody. (B). The same cells transfected with control-siRNA and CD9-siRNA. Anti-CD9 mAb (5H9) was used for immunoblotting. (C). MESO1 and MSTO-CD26 (+) cells were subjected to immunoprecipitation to anti-β1 mAb (4B4), anti-FAK mAb (10G2), and anti-Cas-L Ab (TA248). Immunoblotting was performed with anti-FAK (10G2), and anti-Cas-L Ab (TA248). (D). MESO1 and MSTO-CD26 (+) cells were transfected with control siRNA, CD26 siRNA or CD9 siRNA, then subjected to immunoprecipitation with anti-FAK mAb (10G2), or anti-Cas-L Ab (TA248). Immunoblotting was performed with anti-FAK mAb (10G2) or anti-Cas-L Ab (TA248). (E). MESO1 and MSTO-CD26 (+) transfectants with control siRNA or CD9 siRNA were immunoprecipitated with anti-FAK mAb (10G2) or anti-Cas-L Ab (TA248). Immunoblotting was performed with anti-phosphotyrosine mAb (4G10). Similar results were observed by 3 separate experiments.
Figure 7
Figure 7. Combined treatment with anti-CD26 mAb and anti-CD9 mAb on tumorigenesis.
(A). MSTO-CD26(+) and MESO1 cells were treated with anti-CD26 mAb (10 µg/ml), anti-CD9 mAb (10 µg/ml), or with anti-CD26 mAb (5 µg/ml) + anti-CD9 mAb (5 µg/ml). Cell invasion assay was performed at 24 h. Number of invaded cells was represented as means ± SE (n = 5). *p<0.05, **p<0.01, ***p<0.005. (B). MESO1 cells transfected with shRNAs for control, CD26, CD9, or CD26-CD9 were grown in 96 well culture plates and subjected to MTT assay at indicated times. Each data point represents the mean ± SE of six wells. *p<0.05, **p<0.01. (C). MSTO-CD26(+) and MESO1 cells were treated with anti-CD26 mAb (10 µg/ml), anti-CD9 mAb (10 µg/ml), or with anti-CD26 mAb (5 µg/ml) + anti-CD9 mAb (5 µg/ml). MTT assay was performed at day 2. Each data point represents mean ± SE of six wells. *p<0.05, **p<0.005. (D). SCID mice were inoculated with MESO1 cells transfected with shRNAs for control, CD26, CD9 or CD26-CD9. Tumors were sampled at day 14. Tumor weight was represented as means ± SE (mg) among 5 tumors from each category. The representative tumor images were shown on the top. *p<0.05, **p<0.01. (E).MESO1 cells were implanted into SCID mice and intraperitoneally treated with anti-CD26 mAb (8 mg/kg), anti-CD9 mAb (8 mg/kg), or with anti-CD26 mAb (4 mg/kg) + anti-CD9 mAb (4 mg/kg) 2 times in a week from the day following tumor implantation. Tumors were sampled at day 14. Tumor weight was represented as means ± SE (mg) among 5 tumors from each category. The representative tumor images were shown in the top. *p<0.05, **p<0.01.

References

    1. Ismail-Khan R, Robinson LA, Williams CC Jr, Garrett CR, Bepler G, et al. (2006) Malignant pleural mesothelioma: a comprehensive review. Cancer Control 13: 255–263. - PubMed
    1. Robinson BW, Lake RA (2005) Advances in malignant mesothelioma. N Engl J Med 353: 1591–1603. - PubMed
    1. Morimoto C, Schlossman SF (1998) The structure and function of CD26 in the T-cell immune response. Immunol Rev 161: 55–70. - PubMed
    1. Kameoka J, Tanaka T, Nojima Y, Schlossman SF, Morimoto C (1993) Direct association of adenosine deaminase with a T cell activation antigen, CD26. Science 261: 466–469. - PubMed
    1. Ishii T, Ohnuma K, Murakami A, Takasawa N, Kobayashi S, et al. (2001) CD26-mediated signaling for T cell activation occurs in lipid rafts through its association with CD45RO. Proc Natl Acad Sci U S A 98: 12138–12143. - PMC - PubMed

Publication types

MeSH terms