

Identification of neural networks that contribute to motion sickness through principal components analysis of fos labeling induced by galvanic vestibular stimulation
- PMID: 24466215
- PMCID: PMC3900607
- DOI: 10.1371/journal.pone.0086730
Identification of neural networks that contribute to motion sickness through principal components analysis of fos labeling induced by galvanic vestibular stimulation
Abstract
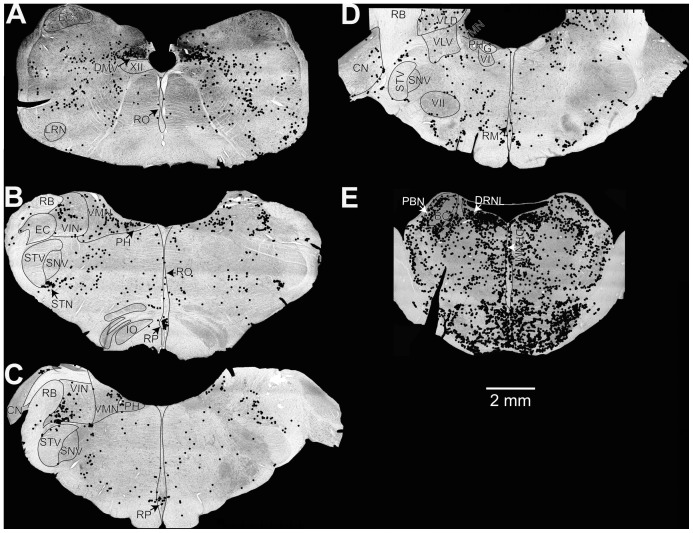
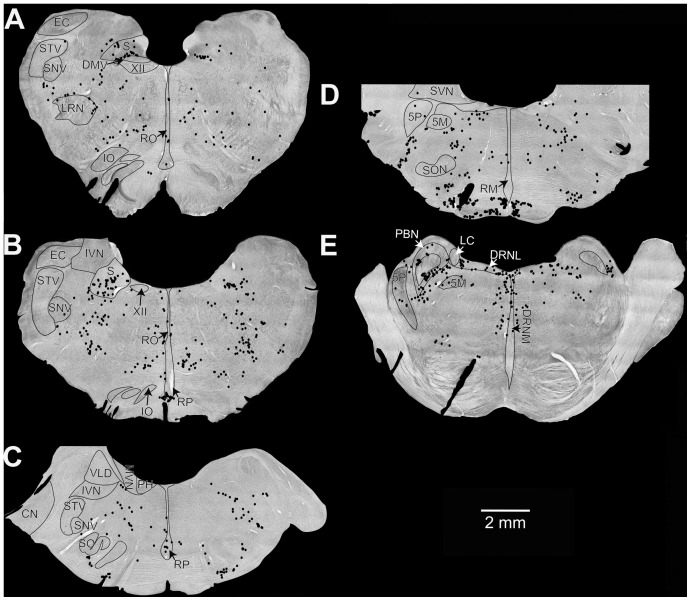
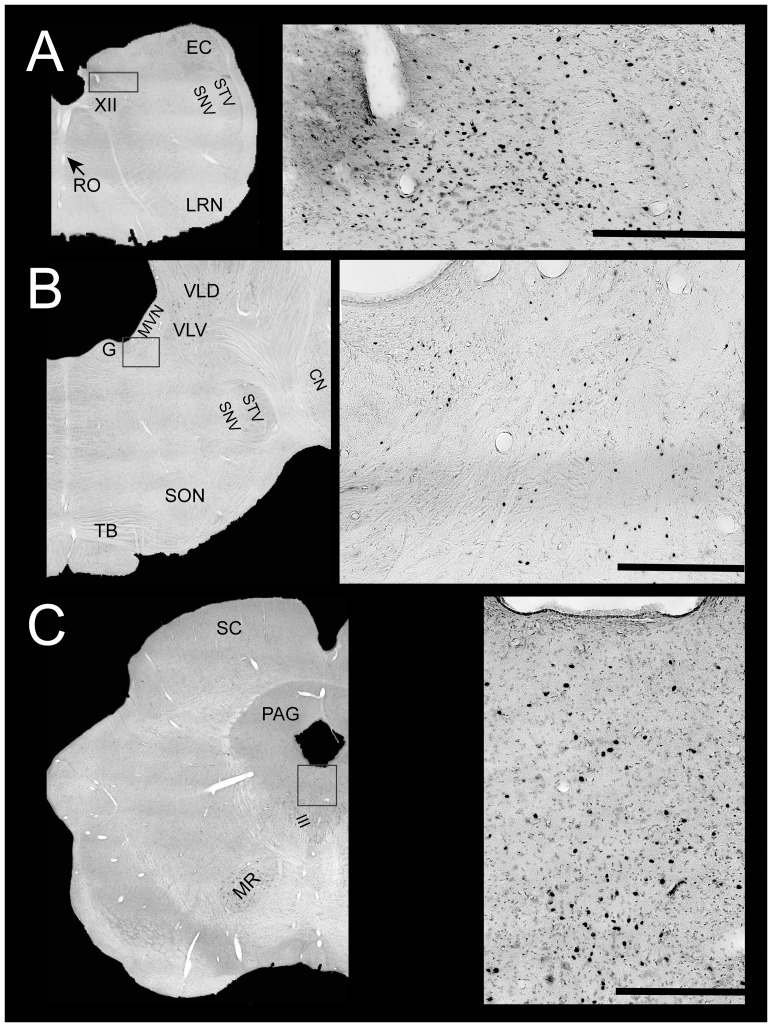
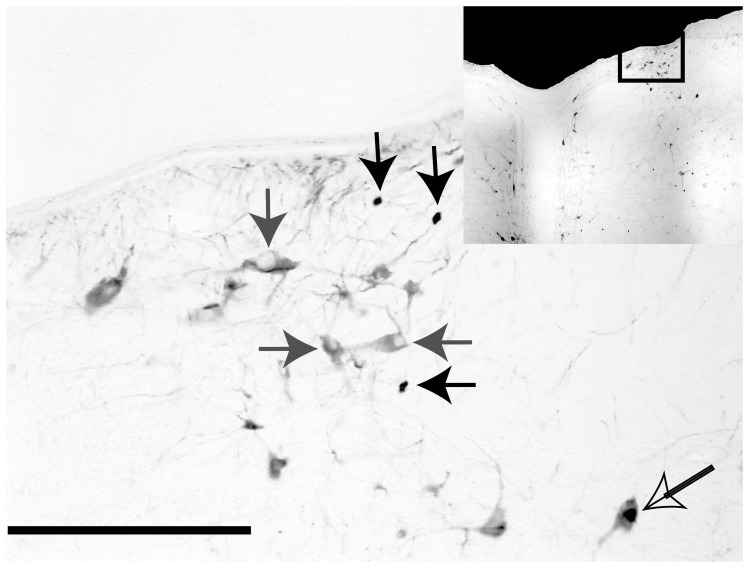
Motion sickness is a complex condition that includes both overt signs (e.g., vomiting) and more covert symptoms (e.g., anxiety and foreboding). The neural pathways that mediate these signs and symptoms are yet to identified. This study mapped the distribution of c-fos protein (Fos)-like immunoreactivity elicited during a galvanic vestibular stimulation paradigm that is known to induce motion sickness in felines. A principal components analysis was used to identify networks of neurons activated during this stimulus paradigm from functional correlations between Fos labeling in different nuclei. This analysis identified five principal components (neural networks) that accounted for greater than 95% of the variance in Fos labeling. Two of the components were correlated with the severity of motion sickness symptoms, and likely participated in generating the overt signs of the condition. One of these networks included neurons in locus coeruleus, medial, inferior and lateral vestibular nuclei, lateral nucleus tractus solitarius, medial parabrachial nucleus and periaqueductal gray. The second included neurons in the superior vestibular nucleus, precerebellar nuclei, periaqueductal gray, and parabrachial nuclei, with weaker associations of raphe nuclei. Three additional components (networks) were also identified that were not correlated with the severity of motion sickness symptoms. These networks likely mediated the covert aspects of motion sickness, such as affective components. The identification of five statistically independent component networks associated with the development of motion sickness provides an opportunity to consider, in network activation dimensions, the complex progression of signs and symptoms that are precipitated in provocative environments. Similar methodology can be used to parse the neural networks that mediate other complex responses to environmental stimuli.
Conflict of interest statement
Figures
Similar articles
-
Effects of visceral inputs on the processing of labyrinthine signals by the inferior and caudal medial vestibular nuclei: ramifications for the production of motion sickness.Exp Brain Res. 2013 Jul;228(3):353-63. doi: 10.1007/s00221-013-3568-3. Epub 2013 May 28. Exp Brain Res. 2013. PMID: 23712685 Free PMC article.
-
Fos-defined activity in rat brainstem following centripetal acceleration.J Neurosci. 1992 Nov;12(11):4489-500. doi: 10.1523/JNEUROSCI.12-11-04489.1992. J Neurosci. 1992. PMID: 1432106 Free PMC article.
-
c-Fos induction by a 14 T magnetic field in visceral and vestibular relays of the female rat brainstem is modulated by estradiol.Brain Res. 2010 Aug 6;1347:48-57. doi: 10.1016/j.brainres.2010.06.002. Epub 2010 Jun 8. Brain Res. 2010. PMID: 20553875 Free PMC article.
-
[The use of c-Fos expression in vestibular function investigation].Space Med Med Eng (Beijing). 1999 Oct;12(5):381-5. Space Med Med Eng (Beijing). 1999. PMID: 12022187 Review. Chinese.
-
The neural basis of motion sickness.J Neurophysiol. 2019 Mar 1;121(3):973-982. doi: 10.1152/jn.00674.2018. Epub 2019 Jan 30. J Neurophysiol. 2019. PMID: 30699041 Review.
Cited by
-
Integration of vestibular and emetic gastrointestinal signals that produce nausea and vomiting: potential contributions to motion sickness.Exp Brain Res. 2014 Aug;232(8):2455-69. doi: 10.1007/s00221-014-3937-6. Epub 2014 Apr 16. Exp Brain Res. 2014. PMID: 24736862 Free PMC article. Review.
-
Effects of the LPA1 Receptor Deficiency and Stress on the Hippocampal LPA Species in Mice.Front Mol Neurosci. 2019 Jun 11;12:146. doi: 10.3389/fnmol.2019.00146. eCollection 2019. Front Mol Neurosci. 2019. PMID: 31244601 Free PMC article.
-
Effects of genetic deletion versus pharmacological blockade of the LPA1 receptor on depression-like behaviour and related brain functional activity.Dis Model Mech. 2018 Sep 10;11(9):dmm035519. doi: 10.1242/dmm.035519. Dis Model Mech. 2018. PMID: 30061118 Free PMC article.
-
New insights into hypothalamic neurogenesis disruption after acute and intense stress: implications for microglia and inflammation.Front Neurosci. 2023 Jun 23;17:1190418. doi: 10.3389/fnins.2023.1190418. eCollection 2023. Front Neurosci. 2023. PMID: 37425000 Free PMC article.
-
Estimating the sensorimotor components of cybersickness.J Neurophysiol. 2018 Nov 1;120(5):2201-2217. doi: 10.1152/jn.00477.2018. Epub 2018 Jul 25. J Neurophysiol. 2018. PMID: 30044672 Free PMC article.
References
-
- Grelot L, Miller A (1994) Vomiting - Its Ins and Outs. News Physiol Sci 9: 142–147.
-
- Miller AD, Grélot L (1996) The neural basis of nausea and vomiting. In: Yates BJ, Miller AD, editors. Vestibular Autonomic Regulation. Boca Raton, FL: CRC Press. 85–94.
-
- Money KE, Lackner JR, Cheung RSK (1996) The autonomic nervous system and motion sickness. In: Yates BJ, Miller AD, editors. Vestibular Autonomic Regulation. Boca Raton, FL: CRC Press. 147–173.
-
- Yates BJ, Miller AD, Lucot JB (1998) Physiological basis and pharmacology of motion sickness: an update. Brain Res Bull 47: 395–406. - PubMed
-
- Money KE (1970) Motion sickness. Physiol Rev 50: 1–39. - PubMed
Publication types
MeSH terms
Substances
Grants and funding
LinkOut - more resources
Full Text Sources
Other Literature Sources
Medical
