

Fibroblasts from type 1 diabetics exhibit enhanced Ca(2+) mobilization after TNF or fat exposure
- PMID: 24466329
- PMCID: PMC3900712
- DOI: 10.1371/journal.pone.0087068
Fibroblasts from type 1 diabetics exhibit enhanced Ca(2+) mobilization after TNF or fat exposure
Abstract
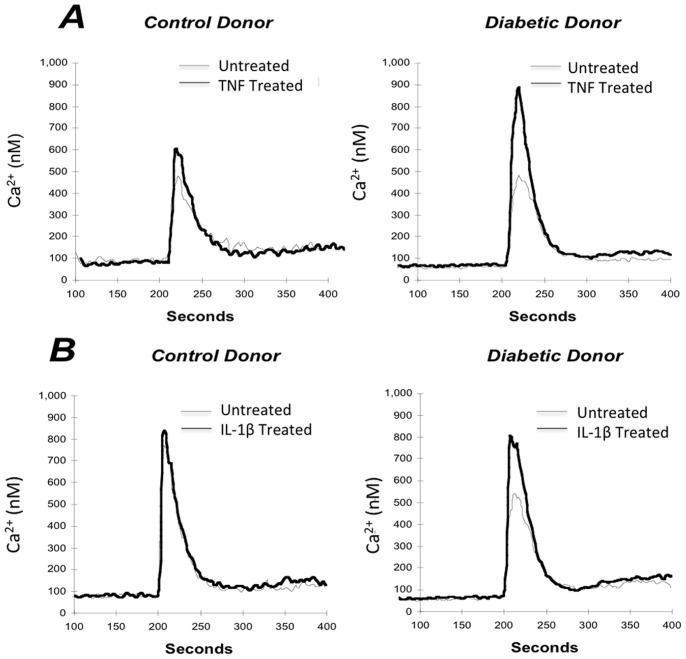
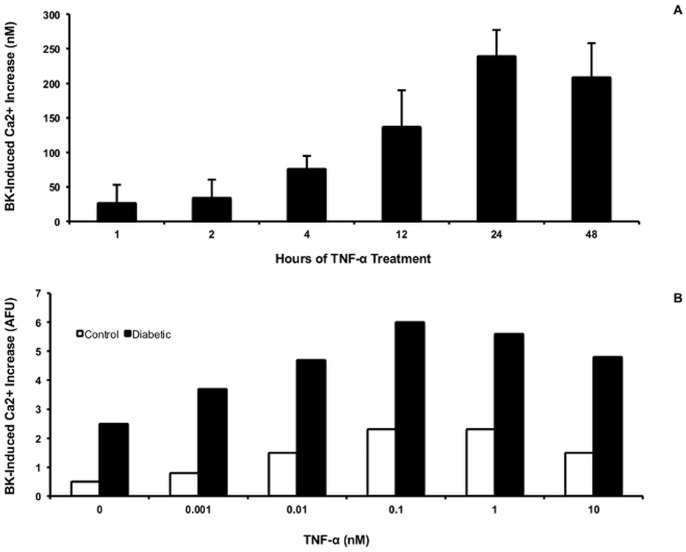
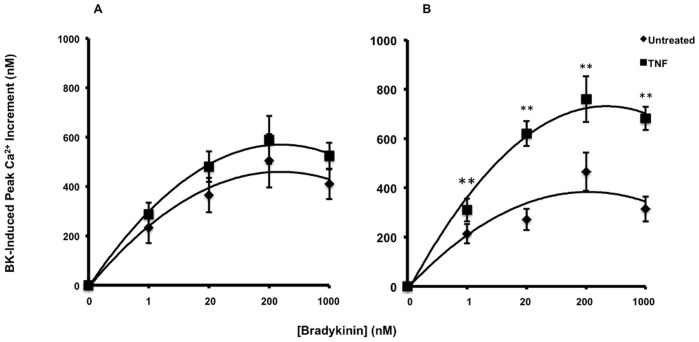
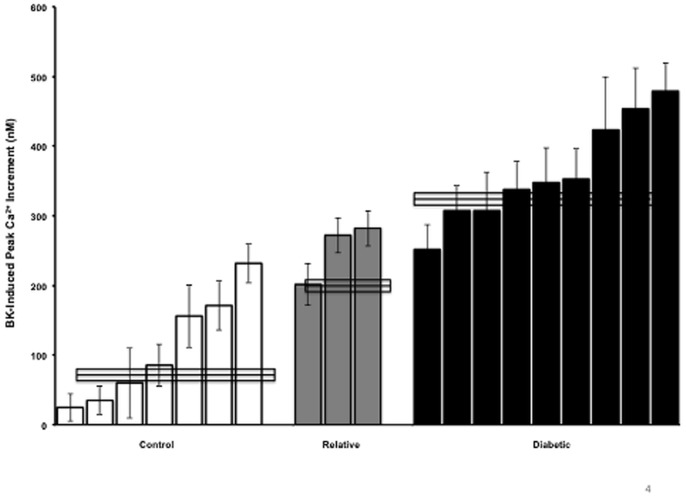
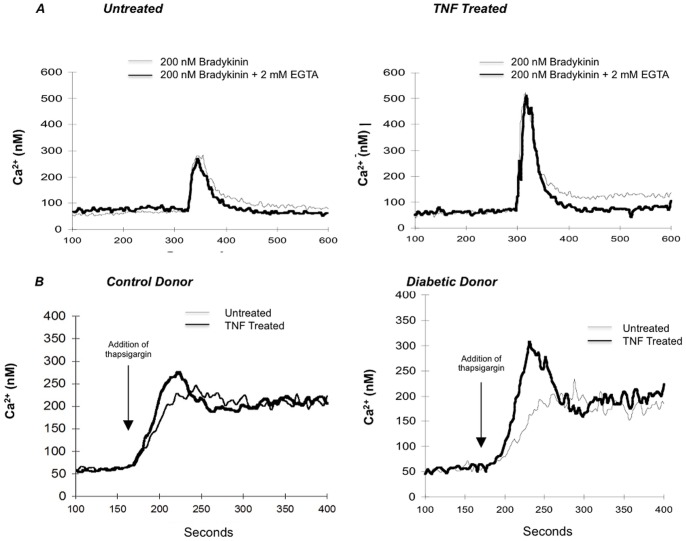
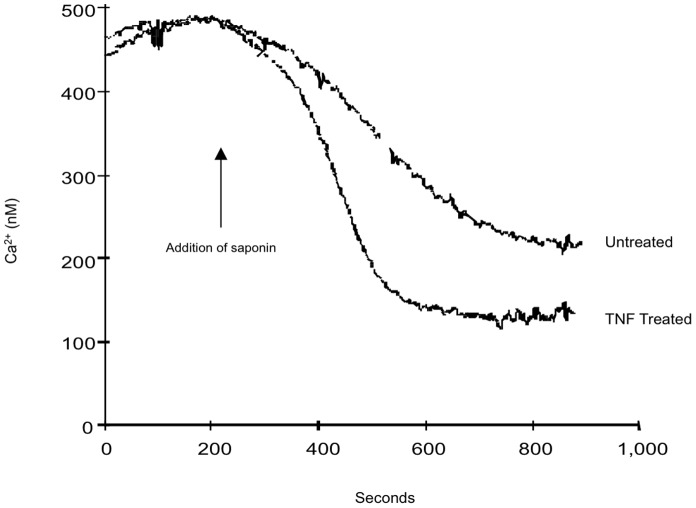
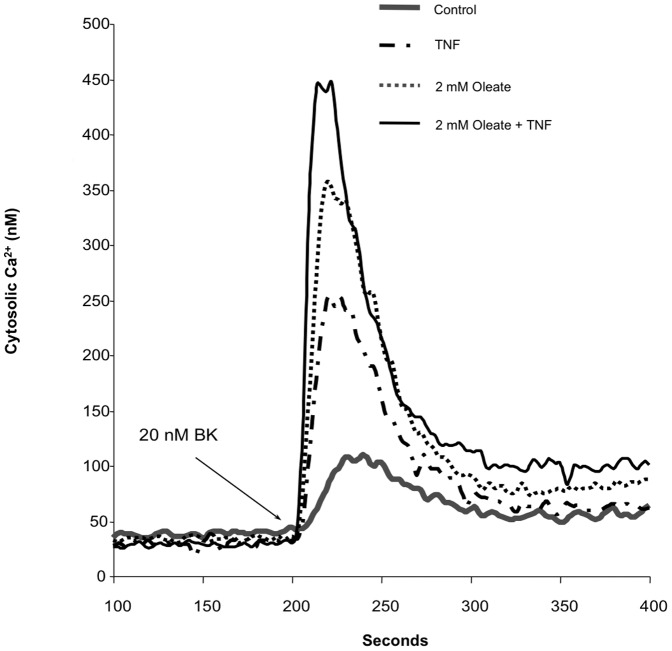
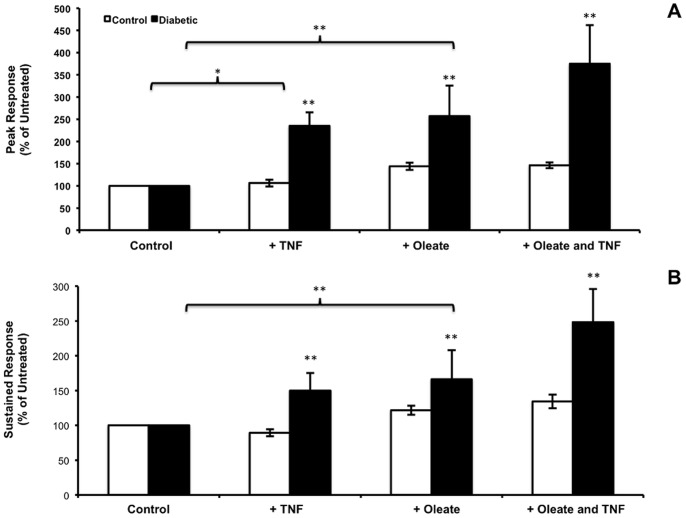
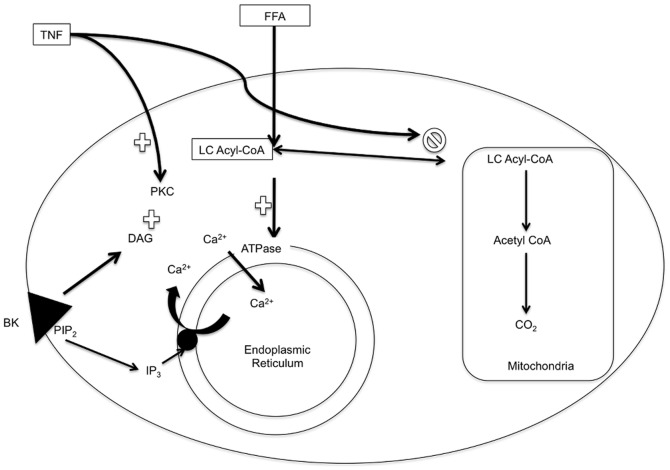
The effects of cytokine and fatty acid treatment on signal transduction in dermal fibroblasts from type 1 diabetics and matched controls were compared. Chronic exposure to TNF, accentuated Ca(2+) mobilization in response to bradykinin (BK) in cells from both controls and diabetics; responses were three-fold greater in cells from diabetics than in controls. Similarly, with chronic exposure to IL-1β, BK-induced Ca(2+) mobilization was accentuated in cells from type 1 diabetics compared to the controls. Pretreatment with the protein synthesis inhibitor cycloheximide or the protein kinase C inhibitor calphostin C prior to the addition of TNF completely abrogated the TNF-induced increment in peak bradykinin response. Ca(2+) transients induced by depleting endoplasmic reticulum (ER) Ca(2+) with thapsigargin were also greater in TNF treated fibroblasts than in untreated cells, with greater increases in cells from diabetics. Exposing fibroblasts for 48 hours to 2 mM oleate also increased both the peak bradykinin response and the TNF-induced increment in peak response, which were significantly greater in diabetics than controls. These data indicate that cells from diabetic patients acquire elevated ER Ca(2+) stores in response to both cytokines and free fatty acids,and thus exhibit greater sensitivity to environmental inflammatory stimuli and elevated lipids.
Conflict of interest statement
Figures
Similar articles
-
Bradykinin synergistically stimulates interleukin 6 production in human gingival fibroblasts challenged with interleukin 1 or tumour necrosis factor alpha.Cytokine. 1998 Jan;10(1):26-31. doi: 10.1006/cyto.1997.0255. Cytokine. 1998. PMID: 9505142
-
Tumour necrosis factor-alpha enhances bradykinin-induced signal transduction via activation of Ras/Raf/MEK/MAPK in canine tracheal smooth muscle cells.Cell Signal. 2001 Sep;13(9):633-43. doi: 10.1016/s0898-6568(01)00182-6. Cell Signal. 2001. PMID: 11495721
-
Bradykinin and thrombin synergistically potentiate interleukin 1 and tumour necrosis factor induced prostanoid biosynthesis in human dental pulp fibroblasts.Cytokine. 1996 Feb;8(2):168-77. doi: 10.1016/s1043-4666(96)99998-6. Cytokine. 1996. PMID: 8777276
-
Mechanisms of bradykinin-induced glucagon release in clonal alpha-cells In-R1-G9: involvement of Ca(2+)-dependent and -independent pathways.Mol Cell Endocrinol. 2002 Jun 28;192(1-2):27-36. doi: 10.1016/s0303-7207(02)00115-6. Mol Cell Endocrinol. 2002. PMID: 12088864
-
Differential regulation of bradykinin receptor density, intracellular Ca2+, and prostanoid release in skin and foreskin fibroblasts. Effects of cell density and interleukin-1alpha.Br J Pharmacol. 1999 May;127(2):583-9. doi: 10.1038/sj.bjp.0702578. Br J Pharmacol. 1999. PMID: 10385262 Free PMC article.
Cited by
-
Hypothesis: Induction of Autoimmunity in Type 1 Diabetes-A Lipid Focus.Diabetes. 2022 Oct 1;71(10):2067-2074. doi: 10.2337/db22-0240. Diabetes. 2022. PMID: 36126206 Free PMC article. Review.
-
Type 1 diabetes alters lipid handling and metabolism in human fibroblasts and peripheral blood mononuclear cells.PLoS One. 2017 Dec 4;12(12):e0188474. doi: 10.1371/journal.pone.0188474. eCollection 2017. PLoS One. 2017. PMID: 29206239 Free PMC article.
References
-
- Cnop M, Welsh N, Jonas JC, Jorns A, Lenzen S, et al. (2005) Mechanisms of pancreatic beta-cell death in type 1 and type 2 diabetes: many differences, few similarities. Diabetes 54 Suppl 2S97–107. - PubMed
-
- Hussain MJ, Peakman M, Gallati H, Lo SS, Hawa M, et al. (1996) Elevated serum levels of macrophage-derived cytokines precede and accompany the onset of IDDM. Diabetologia 39: 60–69. - PubMed
-
- Espersen GT, Mathiesen O, Grunnet N, Jensen S, Ditzel J (1993) Cytokine plasma levels and lymphocyte subsets in patients with newly diagnosed insulin-dependent (type 1) diabetes mellitus before and following initial insulin treatment. Apmis 101: 703–706. - PubMed
-
- Chosich N, Rockett E, Harrison LC (1994) Endogenous TNF production differs between high and low diabetes incidence non-obese diabetic (NOD) mice. Autoimmunity 18: 163–168. - PubMed
Publication types
MeSH terms
Substances
Grants and funding
LinkOut - more resources
Full Text Sources
Other Literature Sources
Medical
Miscellaneous
