

Verification of a two-layer inverse Monte Carlo absorption model using multiple source-detector separation diffuse reflectance spectroscopy
- PMID: 24466475
- PMCID: PMC3891344
- DOI: 10.1364/BOE.5.000040
Verification of a two-layer inverse Monte Carlo absorption model using multiple source-detector separation diffuse reflectance spectroscopy
Abstract
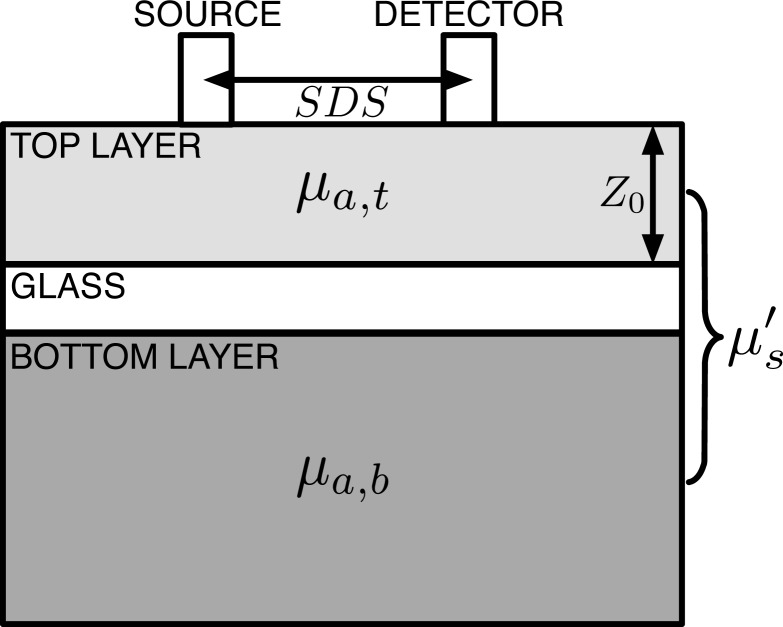
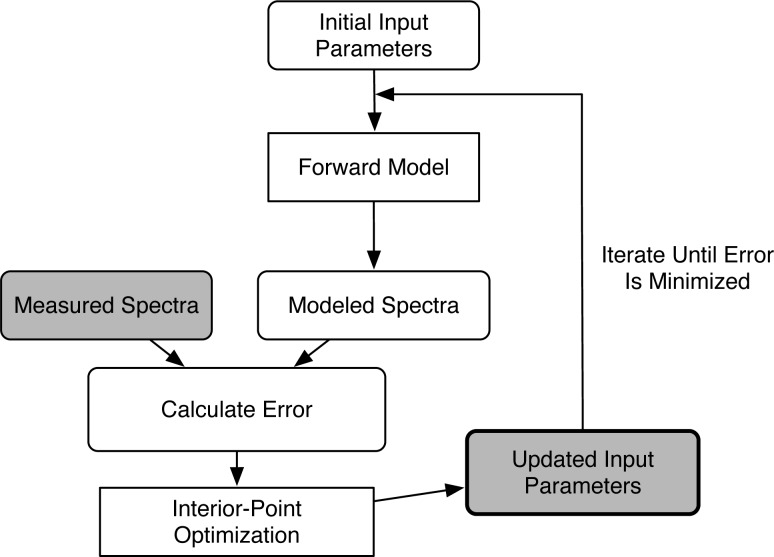
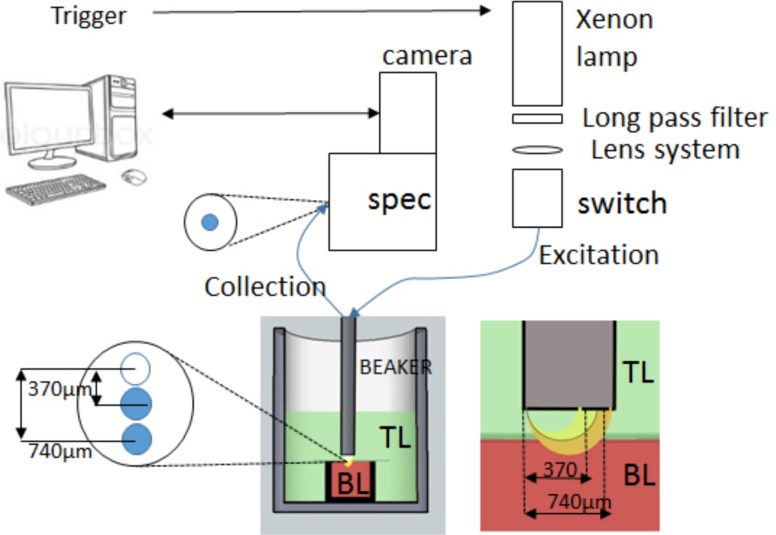
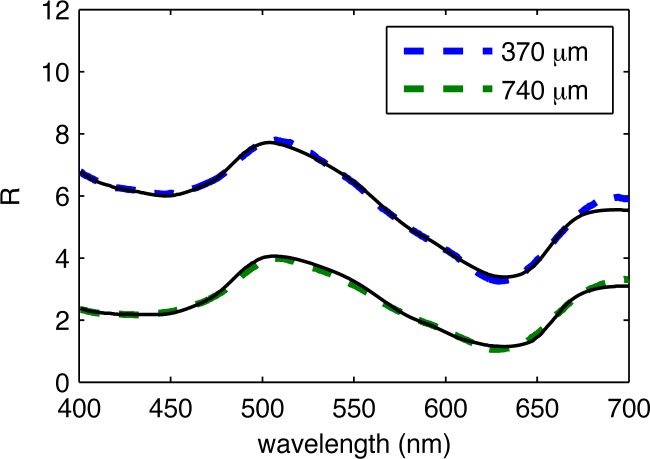
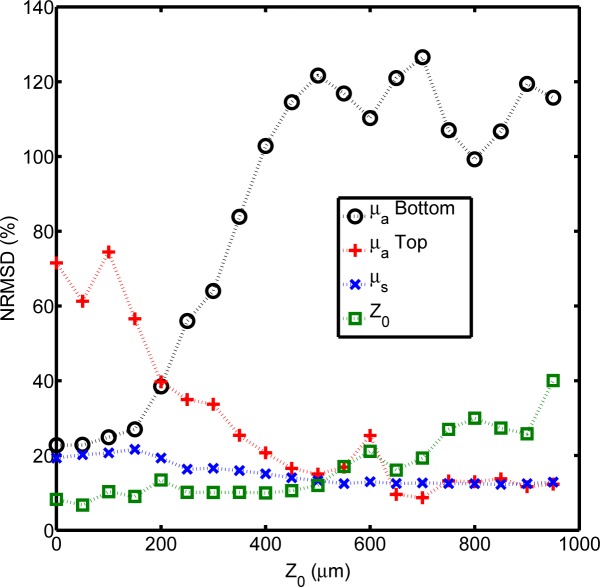
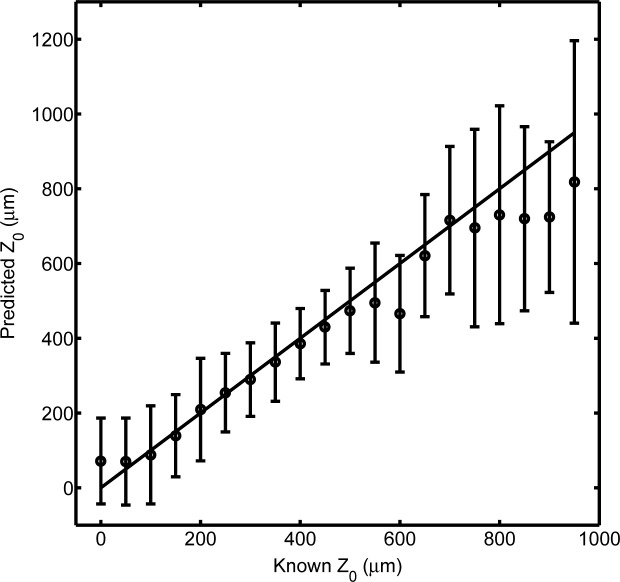
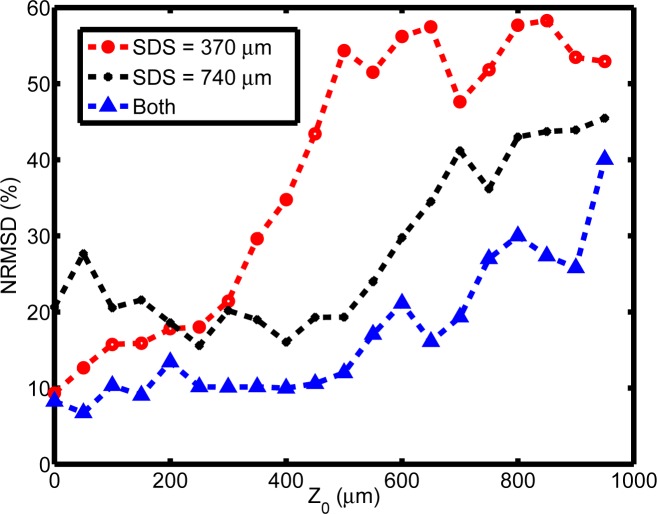
A two-layer Monte Carlo lookup table-based inverse model is validated with two-layered phantoms across physiologically relevant optical property ranges. Reflectance data for source-detector separations of 370 μm and 740 μm were collected from these two-layered phantoms and top layer thickness, reduced scattering coefficient and the top and bottom layer absorption coefficients were extracted using the inverse model and compared to the known values. The results of the phantom verification show that this method is able to accurately extract top layer thickness and scattering when the top layer thickness ranges from 0 to 550 μm. In this range, top layer thicknesses were measured with an average error of 10% and the reduced scattering coefficient was measured with an average error of 15%. The accuracy of top and bottom layer absorption coefficient measurements was found to be highly dependent on top layer thickness, which agrees with physical expectation; however, within appropriate thickness ranges, the error for absorption properties varies from 12-25%.
Keywords: (100.3190) Inverse problems; (170.6510) Spectroscopy, tissue diagnostics.
Figures


Similar articles
-
Bottom layer absorption coefficients extraction from two-layer phantoms based on crossover point in diffuse reflectance.J Biomed Opt. 2021 Nov;26(11):117001. doi: 10.1117/1.JBO.26.11.117001. J Biomed Opt. 2021. PMID: 34850612 Free PMC article.
-
Sequential estimation of optical properties of a two-layered epithelial tissue model from depth-resolved ultraviolet-visible diffuse reflectance spectra.Appl Opt. 2006 Jul 1;45(19):4776-90. doi: 10.1364/ao.45.004776. Appl Opt. 2006. PMID: 16799693
-
Accurate extraction of optical properties and top layer thickness of two-layered mucosal tissue phantoms from spatially resolved reflectance spectra.J Biomed Opt. 2014;19(7):77002. doi: 10.1117/1.JBO.19.7.077002. J Biomed Opt. 2014. PMID: 25027003
-
Monte Carlo lookup table-based inverse model for extracting optical properties from tissue-simulating phantoms using diffuse reflectance spectroscopy.J Biomed Opt. 2013 Mar;18(3):037003. doi: 10.1117/1.JBO.18.3.037003. J Biomed Opt. 2013. PMID: 23455965 Free PMC article.
-
Influence of the phase function in generalized diffuse reflectance models: review of current formalisms and novel observations.J Biomed Opt. 2014;19(7):75005. doi: 10.1117/1.JBO.19.7.075005. J Biomed Opt. 2014. PMID: 25027000 Free PMC article. Review.
Cited by
-
Impact of one-layer assumption on diffuse reflectance spectroscopy of skin.J Biomed Opt. 2015 Feb;20(2):27001. doi: 10.1117/1.JBO.20.2.027001. J Biomed Opt. 2015. PMID: 25649627 Free PMC article.
-
Sampling depth of a diffuse reflectance spectroscopy probe for in-vivo physiological quantification of murine subcutaneous tumor allografts.J Biomed Opt. 2018 Aug;23(8):1-14. doi: 10.1117/1.JBO.23.8.085006. J Biomed Opt. 2018. PMID: 30152204 Free PMC article.
-
Fast and accurate Monte Carlo simulations of subdiffusive spatially resolved reflectance for a realistic optical fiber probe tip model aided by a deep neural network.Biomed Opt Express. 2020 Jun 22;11(7):3875-3889. doi: 10.1364/BOE.391163. eCollection 2020 Jul 1. Biomed Opt Express. 2020. PMID: 33014572 Free PMC article.
-
Robustness of diffuse reflectance spectra analysis by inverse adding doubling algorithm.Biomed Opt Express. 2022 Jan 21;13(2):921-949. doi: 10.1364/BOE.443880. eCollection 2022 Feb 1. Biomed Opt Express. 2022. PMID: 35284194 Free PMC article.
-
Modelling spatially-resolved diffuse reflectance spectra of a multi-layered skin model by artificial neural networks trained with Monte Carlo simulations.Biomed Opt Express. 2018 Mar 7;9(4):1531-1544. doi: 10.1364/BOE.9.001531. eCollection 2018 Apr 1. Biomed Opt Express. 2018. PMID: 29675300 Free PMC article.
References
-
- Skala M. C., Palmer G. M., Vrotsos K. M., Gendron-Fitzpatrick A., Ramanujam N., “Comparison of a physical model and principal component analysis for the diagnosis of epithelial neoplasias in vivo using diffuse reflectance spectroscopy,” Opt. Express 15(12), 7863–7875 (2007).10.1364/OE.15.007863 - DOI - PMC - PubMed
-
- Wan S., Anderson R. R., Parrish J. A., “Analytical modeling for the optical properties of the skin with in vitro and in vivo applications,” Photochem. Photobiol. 34(4), 493–499 (1981). - PubMed
Grants and funding
LinkOut - more resources
Full Text Sources
Other Literature Sources