. 2014;11(8):509-18.
doi: 10.1080/15459624.2013.877591.

Efficacy of face shields against cough aerosol droplets from a cough simulator

Affiliations

Efficacy of face shields against cough aerosol droplets from a cough simulator

William G Lindsley et al. J Occup Environ Hyg. 2014.

Abstract

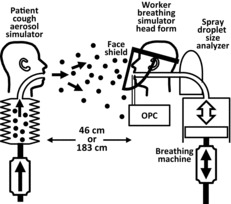
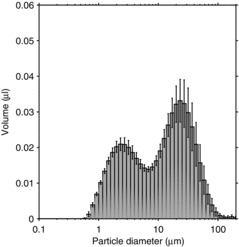
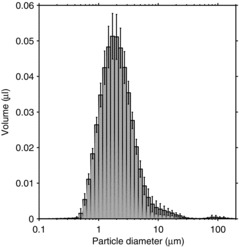
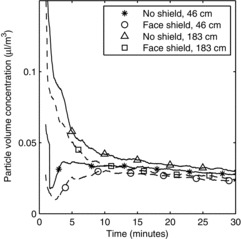
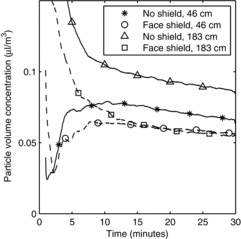
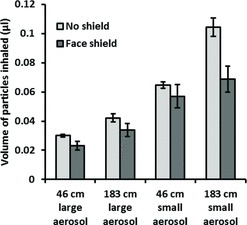
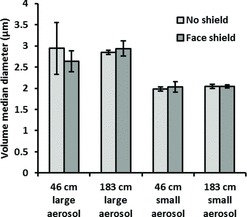
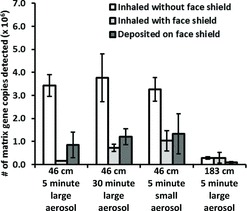
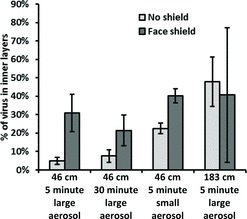
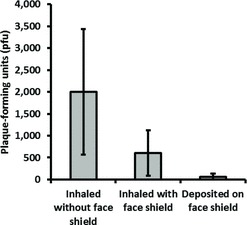
Health care workers are exposed to potentially infectious airborne particles while providing routine care to coughing patients. However, much is not understood about the behavior of these aerosols and the risks they pose. We used a coughing patient simulator and a breathing worker simulator to investigate the exposure of health care workers to cough aerosol droplets, and to examine the efficacy of face shields in reducing this exposure. Our results showed that 0.9% of the initial burst of aerosol from a cough can be inhaled by a worker 46 cm (18 inches) from the patient. During testing of an influenza-laden cough aerosol with a volume median diameter (VMD) of 8.5 μm, wearing a face shield reduced the inhalational exposure of the worker by 96% in the period immediately after a cough. The face shield also reduced the surface contamination of a respirator by 97%. When a smaller cough aerosol was used (VMD = 3.4 μm), the face shield was less effective, blocking only 68% of the cough and 76% of the surface contamination. In the period from 1 to 30 minutes after a cough, during which the aerosol had dispersed throughout the room and larger particles had settled, the face shield reduced aerosol inhalation by only 23%. Increasing the distance between the patient and worker to 183 cm (72 inches) reduced the exposure to influenza that occurred immediately after a cough by 92%. Our results show that health care workers can inhale infectious airborne particles while treating a coughing patient. Face shields can substantially reduce the short-term exposure of health care workers to large infectious aerosol particles, but smaller particles can remain airborne longer and flow around the face shield more easily to be inhaled. Thus, face shields provide a useful adjunct to respiratory protection for workers caring for patients with respiratory infections. However, they cannot be used as a substitute for respiratory protection when it is needed. [Supplementary materials are available for this article. Go to the publisher's online edition of Journal of Occupational and Environmental Hygiene for the following free supplemental resource: tables of the experiments performed, more detailed information about the aerosol measurement methods, photographs of the experimental setup, and summaries of the experimental data from the aerosol measurement devices, the qPCR analysis, and the VPA.].

Keywords: airborne particulate matter; health care workers; infectious disease transmission; protective devices; respiratory infections/prevention; universal precautions.


Figures

FIGURE 1.
FIGURE 1.. Schematic of the experiment using particle spectrometers. The mouth of the cough aerosol simulator and the mouth of the breathing simulator were 152 cm (60 inches) above the floor and 46 cm (18 inches) or 183 cm (72 inches) apart. For experiments using influenza virus, the optical particle counters (OPCs) and the droplet size analyzer were not used, and a respirator was sealed to the breathing head form to act as a filter to collect the virus that was inhaled.
FIGURE 2.
FIGURE 2.. Volume size distribution of the particles inhaled by the breathing simulator in 1.4 sec after a single large-particle cough. The mouths of the coughing and breathing simulators were 46 cm apart, and the breathing simulator was not wearing a face shield. The plot is the average of 6 coughs. The error bars show the standard deviation (SD).
FIGURE 3.
FIGURE 3.. Volume size distribution of the particles inhaled by the breathing simulator in 1.4 sec after a single small-particle cough. The mouths of the coughing and breathing simulators were 46 cm apart, and the breathing simulator was not wearing a face shield. The plot is the average ±SD of 6 coughs.
FIGURE 4.
FIGURE 4.. Volume concentration of airborne particles at the mouth of the breathing simulator from 1 to 30 min after a single large-aerosol particle cough. The plots are restricted to 1 min to 30 min after the cough because the aerosol concentration exceeded the upper limit of the instrument during the first 50 sec. Each line is the average of 3 tests. The lines were smoothed with a 61-point running average. Every 300th point is marked with a symbol to aid in distinguishing the lines.
FIGURE 5.
FIGURE 5.. Volume concentration of airborne particles at the mouth of the breathing simulator from 1 to 30 min after a single small-aerosol particle cough. Each line is the average of 3 tests. The lines were smoothed with a 61-point running average. Every 300th point is marked with a symbol to aid in distinguishing the lines.
FIGURE 6.
FIGURE 6.. Volume of aerosol particles inhaled by the breathing simulator from 1 min to 30 min after a single cough. Each bar is the average ±SD of 3 experiments.
FIGURE 7.
FIGURE 7.. Volume median diameter of aerosol particles inhaled by the breathing simulator from 1 min to 30 min after a single cough. Each bar is the average ±SD of 3 experiments.
FIGURE 8.
FIGURE 8.. Number of influenza virus copies inhaled by the breathing simulator or deposited on the face shield after a single cough. Each bar is the average ±SD of 3 experiments.
FIGURE 9.
FIGURE 9.. Amount of influenza virus that was detected in the inner layers of the respirator, compared to the total amount detected in all layers. These results are plotted as a ratio for ease of interpretation, but the absolute amount of virus collected at 183 cm was significantly less than collected at 46 cm (see Figure 8). Each bar is the average ±SD of 3 experiments.
FIGURE 10.
FIGURE 10.. Amount of viable influenza virus inhaled by the breathing simulator or deposited on the face shield 5 min after a single large-aerosol particle cough. The coughing and breathing simulators were 46 cm apart. Each bar is the average ±SD of 3 experiments.

Comment in

References

    1. Siegel J.D., Rhinehart E., Jackson M., and Chiarello L.: 2007. Guideline for isolation precautions: Preventing transmission of infectious agents in health care settings. Am. J. Infect. Control 35(10 Suppl 2):S65–164 (2007). - PMC - PubMed
    1. McCool F.D.: Global physiology and pathophysiology of cough: ACCP evidence-based clinical practice guidelines. Chest 129(1 Suppl):48S–53S (2006). - PubMed
    1. Gralton J., Tovey E., McLaws M.L., and Rawlinson W.D.: The role of particle size in aerosolised pathogen transmission: A review. J. Infect. 62(1):1–13 (2011). - PMC - PubMed
    1. Nicas M., Nazaroff W.W., and Hubbard A.: Toward understanding the risk of secondary airborne infection: Emission of respirable pathogens. J. Occup. Environ. Hyg. 2(3):143–154 (2005). - PMC - PubMed
    1. Lindsley W.G., King W.P., Thewlis R.E., et al. : Dispersion and exposure to a cough-generated aerosol in a simulated medical examination room. J. Occup. Environ. Hyg. 9(12):681–690 (2012). - PMC - PubMed

Publication types