

Effective connectivity maps in the swine somatosensory cortex estimated from electrocorticography and validated with intracortical local field potential measurements
- PMID: 24467225
- PMCID: PMC3961777
- DOI: 10.1089/brain.2013.0177
Effective connectivity maps in the swine somatosensory cortex estimated from electrocorticography and validated with intracortical local field potential measurements
Abstract
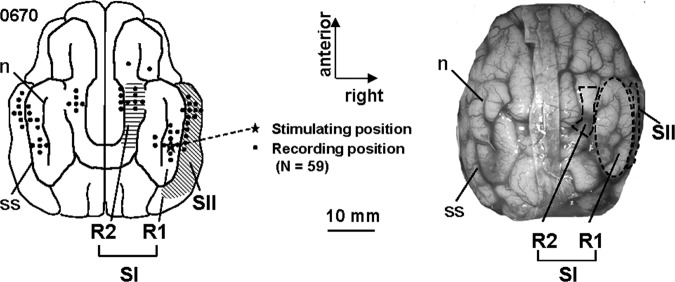
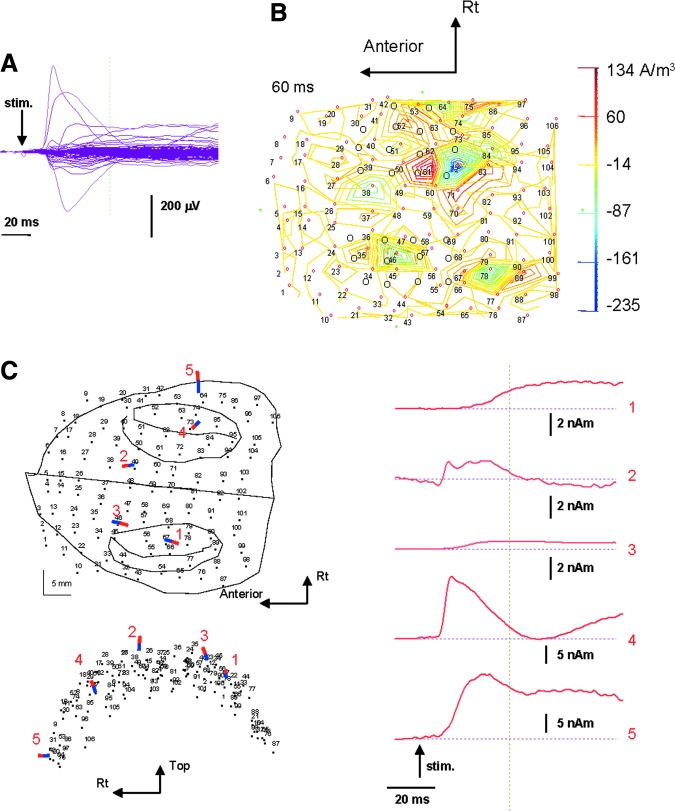
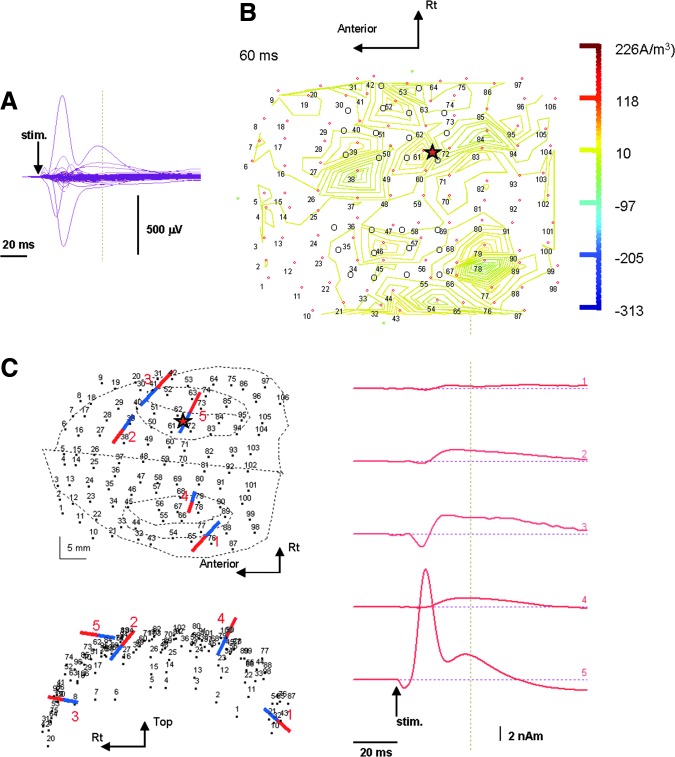
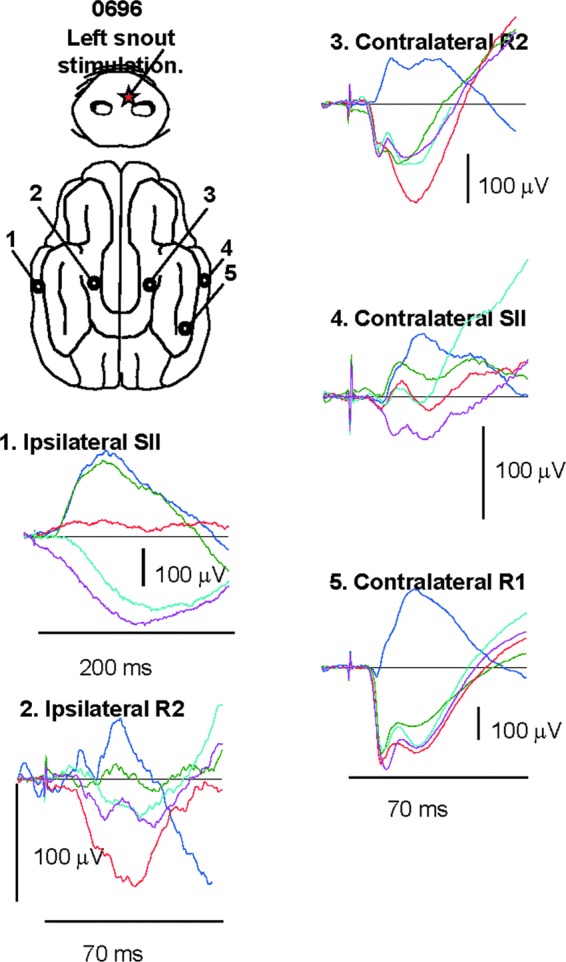
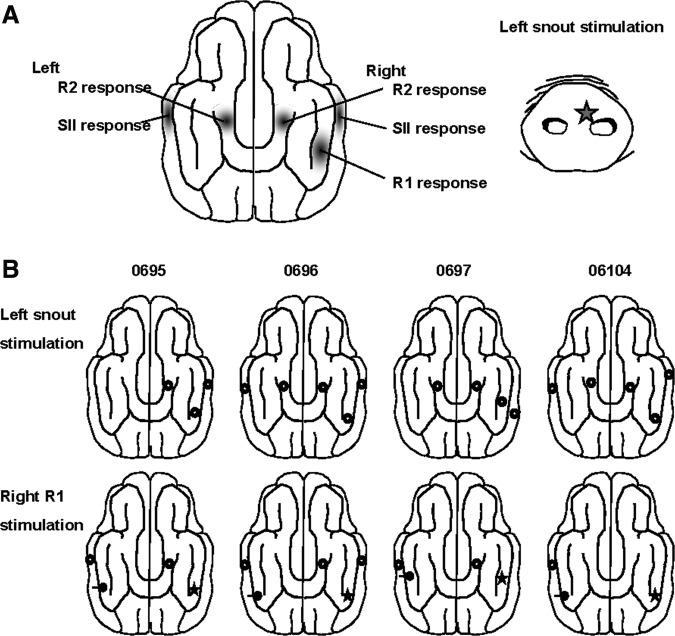
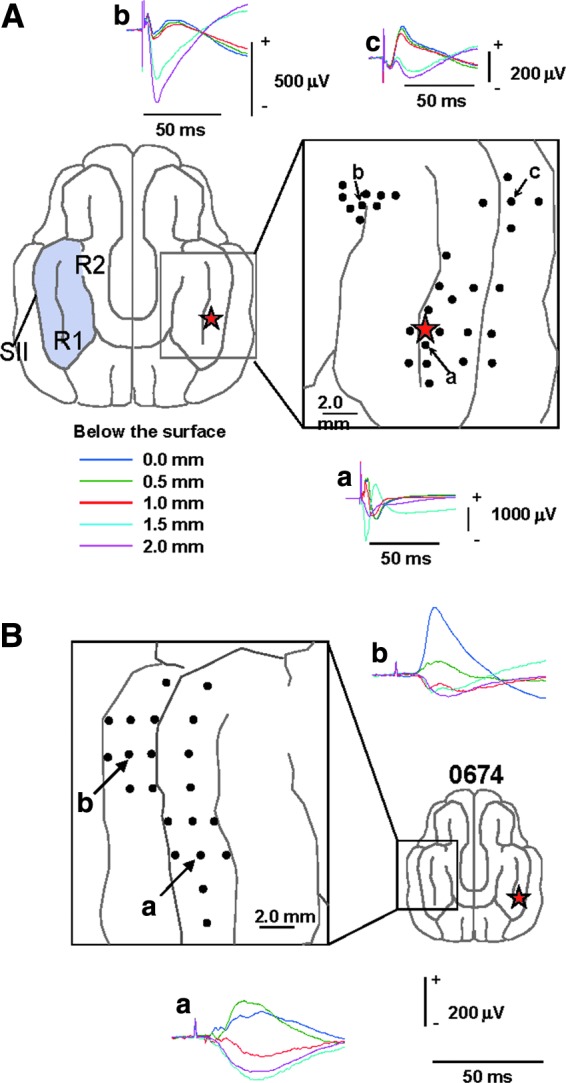
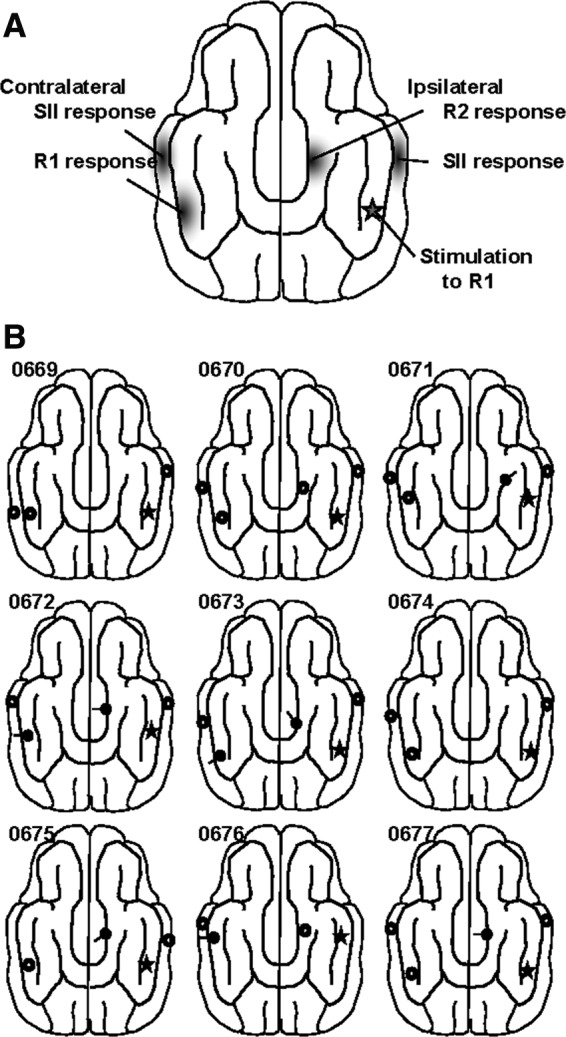
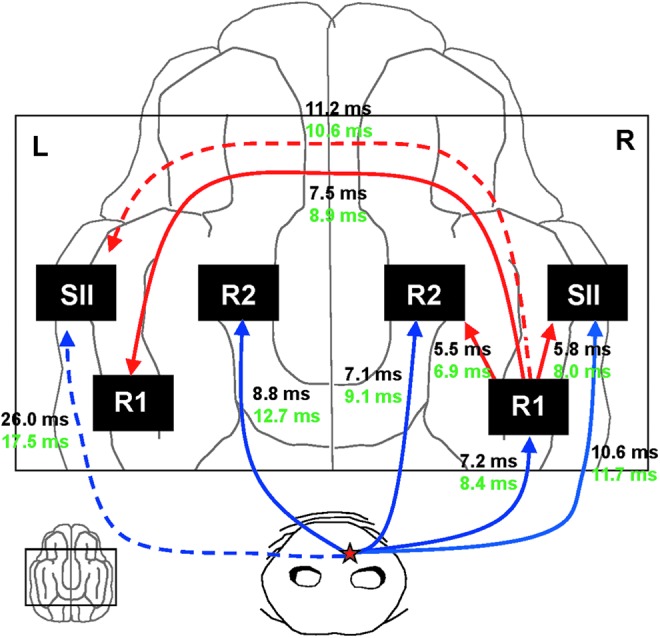
Macroscopic techniques are increasingly being used to estimate functional connectivity in the brain, which provides valuable information about brain networks. In any such endeavors it is important to understand capabilities and limitations of each technique through direct validation, which is often lacking. This study evaluated a multiple dipole source analysis technique based on electrocorticography (ECOG) data in estimating effective connectivity maps and validated the technique with intracortical local field potential (LFP) recordings. The study was carried out in an animal model (swine) with a large brain to avoid complications caused by spreading of the volume current. The evaluation was carried out for the cortical projections from the trigeminal nerve and corticocortical connectivity from the first rostrum area (R1) in the primary somatosensory cortex. Stimulation of the snout and layer IV of the R1 did not activate all projection areas in each animal, although whenever an area was activated in a given animal, its location was consistent with the intracortical LFP. The two types of connectivity maps based on ECOG analysis were consistent with each other and also with those estimated from the intracortical LFP, although there were small discrepancies. The discrepancies in mean latency based on ECOG and LFP were all very small and nonsignificant: snout stimulation, -1.1-2.0 msec (contralateral hemisphere) and 3.9-8.5 msec (ipsilateral hemisphere); R1 stimulation, -1.4-2.2 msec for the ipsilateral and 0.6-1.4 msec for the contralateral hemisphere. Dipole source analysis based on ECOG appears to be quite useful for estimating effective connectivity maps in the brain.
Figures
Similar articles
-
A time-varying source connectivity approach to reveal human somatosensory information processing.Neuroimage. 2012 Aug 1;62(1):217-28. doi: 10.1016/j.neuroimage.2012.03.094. Epub 2012 May 11. Neuroimage. 2012. PMID: 22580382
-
Mapping functional connectivity in barrel-related columns reveals layer- and cell type-specific microcircuits.Brain Struct Funct. 2007 Sep;212(2):107-19. doi: 10.1007/s00429-007-0147-z. Epub 2007 Jun 26. Brain Struct Funct. 2007. PMID: 17717691 Review.
-
Stimulation of dural vessels excites the SI somatosensory cortex of the cat via a relay in the thalamus.Cephalalgia. 2014 Apr;34(4):243-57. doi: 10.1177/0333102413508239. Epub 2013 Oct 14. Cephalalgia. 2014. PMID: 24126945
-
Intracortical processes regulating the integration of sensory information.Prog Brain Res. 1990;86:129-41. doi: 10.1016/s0079-6123(08)63172-6. Prog Brain Res. 1990. PMID: 1982365 Review.
-
Multiple frequency functional connectivity in the hand somatosensory network: an EEG study.Clin Neurophysiol. 2013 Jun;124(6):1216-24. doi: 10.1016/j.clinph.2012.12.004. Epub 2013 Jan 8. Clin Neurophysiol. 2013. PMID: 23306037
Cited by
-
Inferring Cortical Connectivity from ECoG Signals Using Graph Signal Processing.IEEE Access. 2019;7:109349-109362. doi: 10.1109/access.2019.2934490. Epub 2019 Aug 12. IEEE Access. 2019. PMID: 36883134 Free PMC article.
-
Comparison of Subdural and Intracortical Recordings of Somatosensory Evoked Responses.Sensors (Basel). 2024 Oct 25;24(21):6847. doi: 10.3390/s24216847. Sensors (Basel). 2024. PMID: 39517744 Free PMC article.
-
An interspecies comparative study of invasive electrophysiological functional connectivity.Brain Behav. 2017 Nov 22;7(12):e00863. doi: 10.1002/brb3.863. eCollection 2017 Dec. Brain Behav. 2017. PMID: 29299382 Free PMC article.
-
Porcine Model of Cerebral Ischemic Stroke Utilizing Intracortical Recordings for the Continuous Monitoring of the Ischemic Area.Sensors (Basel). 2024 May 7;24(10):2967. doi: 10.3390/s24102967. Sensors (Basel). 2024. PMID: 38793822 Free PMC article.
-
Hydrogel-Based Organic Subdural Electrode with High Conformability to Brain Surface.Sci Rep. 2019 Sep 16;9(1):13379. doi: 10.1038/s41598-019-49772-z. Sci Rep. 2019. PMID: 31527626 Free PMC article.
References
-
- Barth DS, Kithas J, Di S. 1994. The anatomic organization of evoked potentials in rat parietal cortex: electrically evoked commissural responses. J Neurophysiol 72:139–149 - PubMed
-
- Blatow M, Nennig E, Durst A, Sartor K, Stippich C. 2007. fMRI reflects functional connectivity of human somatosensory cortex. NeuroImage 37:927–936 - PubMed
Publication types
MeSH terms
Grants and funding
LinkOut - more resources
Full Text Sources
Other Literature Sources
