

Review
doi: 10.1021/cr400641x.
Epub 2014 Jan 27.
Mechanism of nitrogen fixation by nitrogenase: the next stage
Affiliations
- PMID: 24467365
- PMCID: PMC4012840
- DOI: 10.1021/cr400641x
Item in Clipboard
Review
Mechanism of nitrogen fixation by nitrogenase: the next stage
Chem Rev.
.
No abstract available
Figures
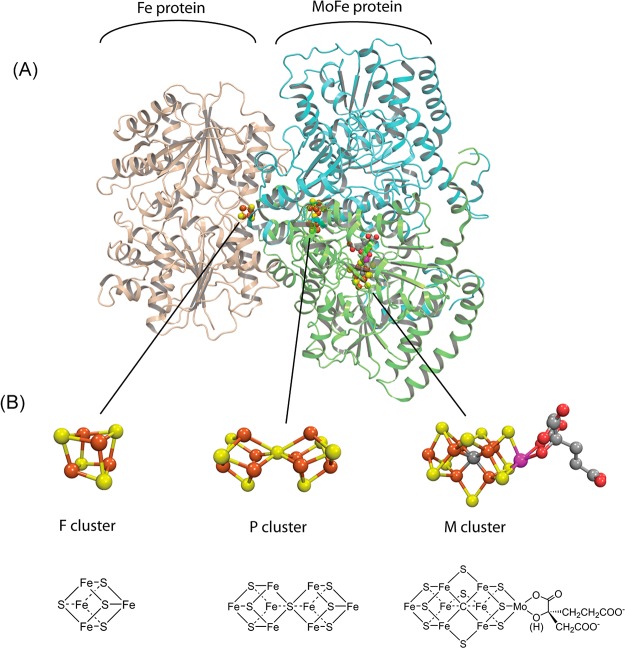
Molybdenum nitrogenase. (A) One catalytic
half of the Fe protein:MoFe
protein complex with the Fe protein homodimer shown in tan, the MoFe
protein α subunit in green, and the β subunit in cyan.
(B) Space filling and stick models for the 4Fe–4S cluster (F),
P-cluster (P), and FeMo-co (M). Made with Pymol and ChemDraw using
PDB:2AFK.

FeMo-cofactor and the side chains of selected amino acid residues
of the MoFe protein. Numbering of iron atoms is according to the structure
PDB coordinate 2AFK. Iron is shown in rust, molybdenum in magenta, nitrogen in blue,
sulfur in yellow, carbon in gray, and oxygen in red.

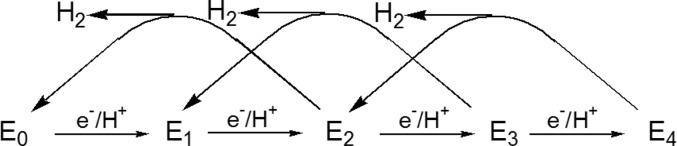
Simplified LT kinetic
scheme that highlights correlated electron/proton
delivery in eight steps. Although in the full LT scheme N2 binds at either the E3 or E4 levels, the pathway
through E3 is de-emphasized here. LT also denotes the protons
bound to FeMo-co (e.g., E1H1); for clarity we
have omitted these protons in this scheme.
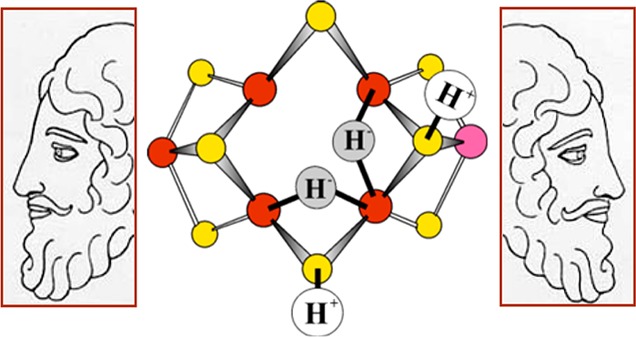
Depiction of E4 as containing two [Fe–H–Fe]
moieties, emphasizing the essential role of this key “Janus
intermediate”, which comes at the halfway point in the LT scheme,
having accumulated four [e–/H+], and
whose properties have implications for the first and second halves
of the scheme. Janus image adapted from http://www.plotinus.com/janus_copy2.htm . Figure adapted with permission from ref (156). Copyright 2013 American Chemical Society.
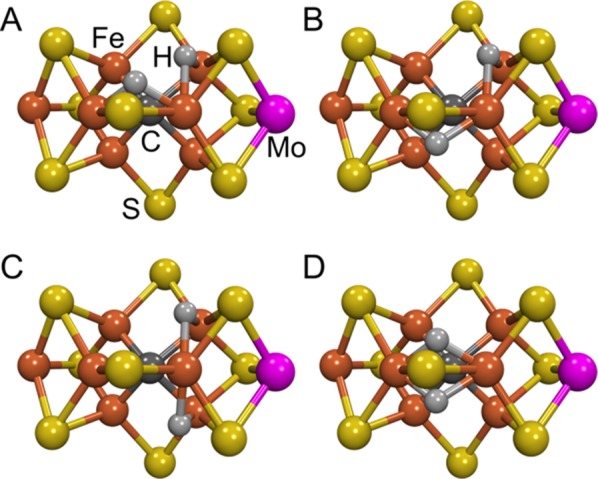
Mockups of the “Janus” E4 intermediate
in which the two bridging hydrides [Fe–H–Fe] revealed
by ENDOR spectroscopy are built onto the resting-state crystal structure.
These models of FeMo-co have Fe6 as a “vertex” for the
two bridging hydrides to facilitate reductive elimination. The figure
was generated using the coordinate file PDB:2AFK. Iron is shown in
rust, molybdenum in magenta, sulfur in yellow, carbon in dark gray,
and hydrogen in light gray.
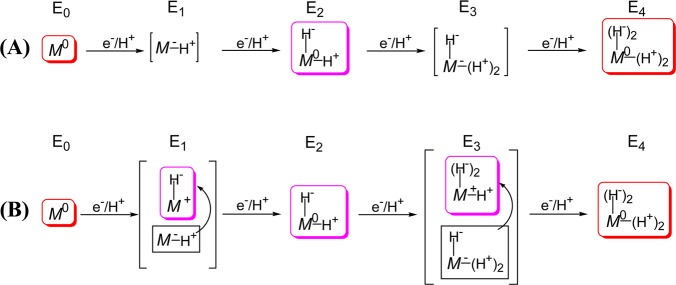
Formulations of E1–E4 derived
from
consideration of E4 as containing two bound hydrides and
two protons. (A) Assuming reduction of the core in n = 1, 3 states. (B) Alternative formulation of E1–E4 under the assumption of hydride formation at every stage,
in which case the core is formally oxidized for En, n = 1, 3. Symbols: M represents FeMo-co
core; superscripts are charge difference between core and that of
resting-state (commonly denoted MN); the number of bound
protons/hydrides are indicated. Adapted with permission from ref (156). Copyright 2013 American
Chemical Society.
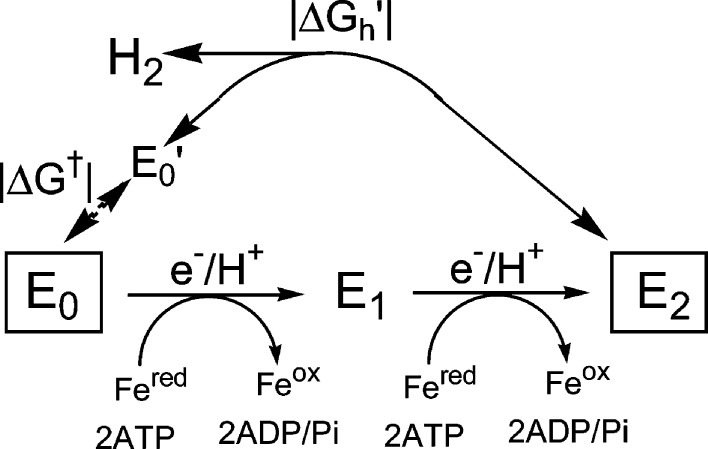
Formation
and relaxation of E2. In-line: The “on-path”
two-step, ATP-dependent addition of two H+/e– to MoFe protein to form E2. Off-line: Representation
of the exergonic (free energy, +|ΔGh|) “off-path” relaxation of E2, liberating
H2 and directly regenerating E0 without intervention
of Fe protein, and of the energetically (free energy, +|ΔGh|) and kinetically forbidden reverse of this
process; E0′ is a putative intermediate state that
causes the reaction of E0 not to be the microscopic reverse
of the release of H2 from E2 (see text).

Comparison of distal (D) and alternating
(A) pathways for N2 hydrogenation, highlighting the stages
that best distinguish
them, most especially noting the different stages at which NH3(1) is released.
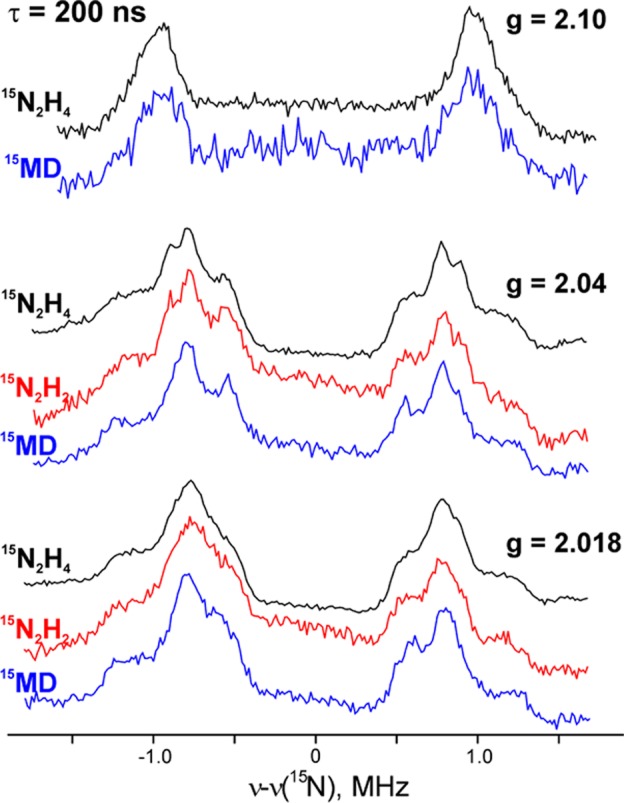
Comparison of 35 GHz
ReMims pulsed 15N ENDOR spectra
of intermediates trapped during turnover of the α-70Ala/α-195Gln MoFe protein with 15N2H4, 15N2H2, and 15NH=N—CH3 (denoted 15MD).
Adapted with permission from ref (207). Copyright 2011 American Chemical Society.

2K Q-band CW EPR spectrum of α-70Val→Ala, α-195His→Gln MoFe protein in resting-state
(S = 3/2) and trapped during
turnover with 14N2H4. Kramers intermediate I and non-Kramers intermediate, H, are noted
in the turnover spectrum. Adapted with permission from ref (219). Copyright 2012 National
Academy of Sciences.
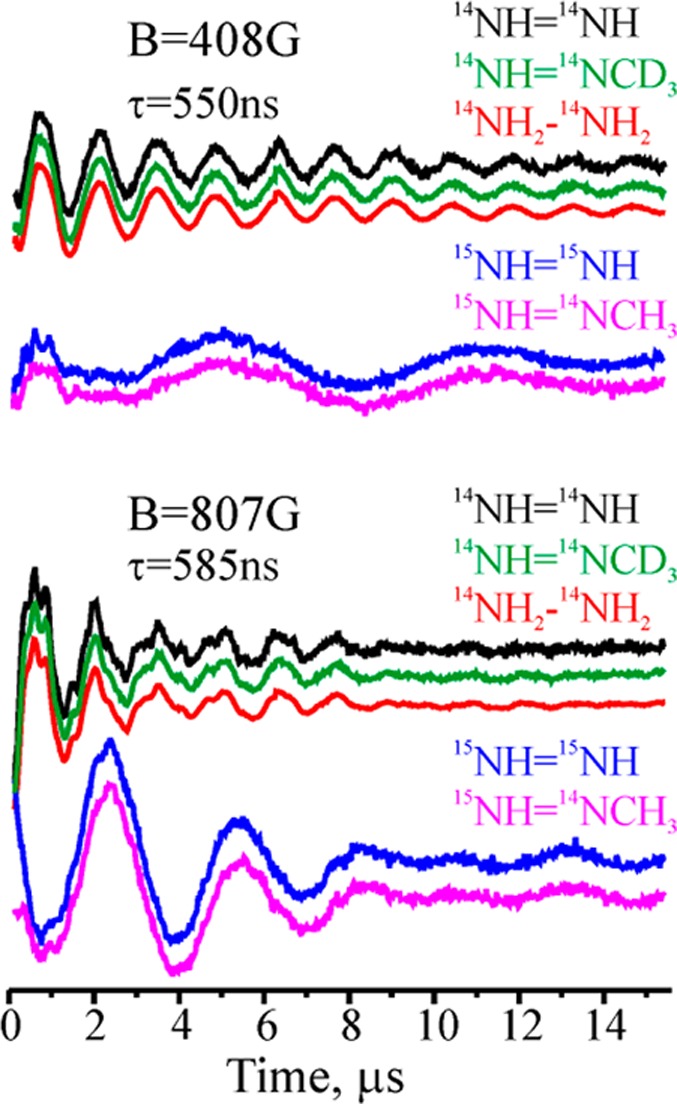
Three-pulse ESEEM traces
after decay-baseline subtraction for NK
intermediate H of α-70Val→Ala, α-195His→Gln MoFe protein trapped during
turnover with 14NH=14NH, 14NH=14NCD3, 14NH2—14NH2, 15NH=15NH, 15NH=14NCH3.
Adapted with permission from ref (219). Copyright 2012 National Academy of Sciences.

Integration of LT kinetic
scheme with “prompt” (P)
alternating (A) pathway for N2 reduction. The ? represents
the product of N2 binding with H2 release, whose
identity is discussed below. Also shown is how diazene and hydrazine
join the N2 reduction pathway. Note: M denotes FeMo-co
in its entirety, and substrate-derived species are drawn to indicate
stoichiometry only, not mode of substrate binding. En states, n = even, are Kramers states; n = odd are non-Kramers. MN denotes resting-state
FeMo-co. Individual charges on M and a substrate fragment, not shown,
sum to the charge on resting FeMo-co. Adapted with permission from
ref (156) with corrections
based on the re mechanism for H2 loss upon N2 binding discussed below. Copyright 2013 American Chemical Society.

Visualization
of hp and re mechanisms for H2 release
upon N2 (blue) binding to E4. The following
is shown: the Fe-2,3,6,7 face of resting FeMo-co; the structure of
FeMo-co must distort in different stages of catalysis. The Fe that
binds N2 is presumed to be Fe6, as indicated by studies
of α-70Val variants; when bold, red, Fe6 is formally
reduced by two equivalents (see text). The bridging hydrides of E4 (green) are positioned to share an Fe “vertex”,
as suggested by re mechanism of H2 release upon N2 binding. Alternative binding modes for N2-derived species
can be envisaged.

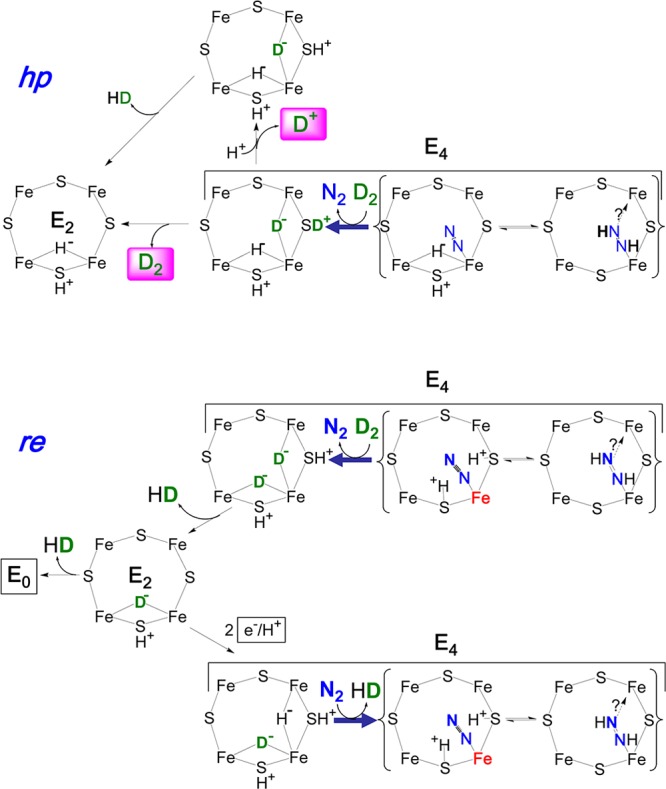
Reversal of hp and re
mechanisms upon D2 binding. Details
as in Figure 13. Bold arrows replace equilibrium
arrows to emphasize the relaxation process.

Formation
of deuterated acetylenes during turnover under N2/D2/C2H2 as predicted according
to re mechanism. Cartoons again depict the Fe2,3,6,7 face of resting-state
FeMo-co, with no attempt to incorporate likely structural modifications.
Figure shows that the “reverse” of re mechanism through
displacement of N2 by D2 produces, successively,
E4(2D) and E2(D), further showing potential
reaction channels for capture of E4(2D) and E2(D) intermediates with C2H2.

Schematic mechanism for reaction of C2H2 with
E4(2D) and E2(D). (A) Formation of C2H2D2, which follows Scheme 15.20 of Hartwig: mi = migratory insertion; re = reductive elimination.
In braces: Possible alternative reaction channel that leads to formation
of C2H3D, ap = alkenyl protonolysis. (B) Schematic
mechanism for formation of C2H3D from reaction
of C2H2 with E2(D). (C) Illustration
of possibility that C2H2 displaces D2 formed by reductive elimination of the E4(2D) deuterides,
leading to direct formation of C2H4 without
D incorporation.
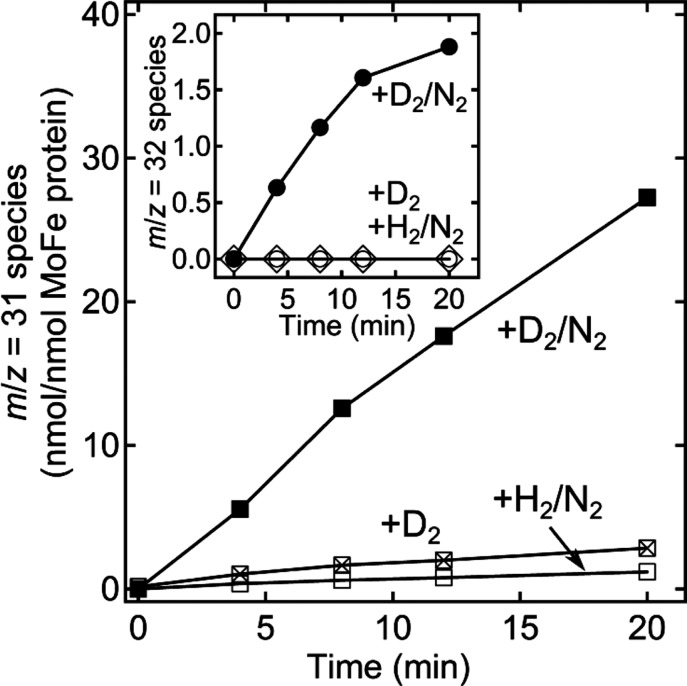
Time-dependent formation of 13C2H3D and 13C2H2D2, catalyzed
by nitrogenase reduction of 13C2H2. 13C2H3D determined by GC/MS monitoring
of m/z = 31 for a reaction mixture
containing 13C2H2 and including D2 and N2 (■), just D2 (x inside
□), or H2 and N2 (□). Inset: 13C2H2D2, m/z = 32, formation starting with 13C2H2/D2/N2 (●), just
D2 (◊), or H2/N2 (○).
Partial pressures of 0.02 atm 13C2H2, 0.25 atm N2, and 0.7 atm H2/D2, where present. The molar ratio of Fe protein to MoFe protein was
2:1. All assays incubated at 30 °C. Adapted with permission from
ref (157). Copyright
2013 National Academy of Sciences.
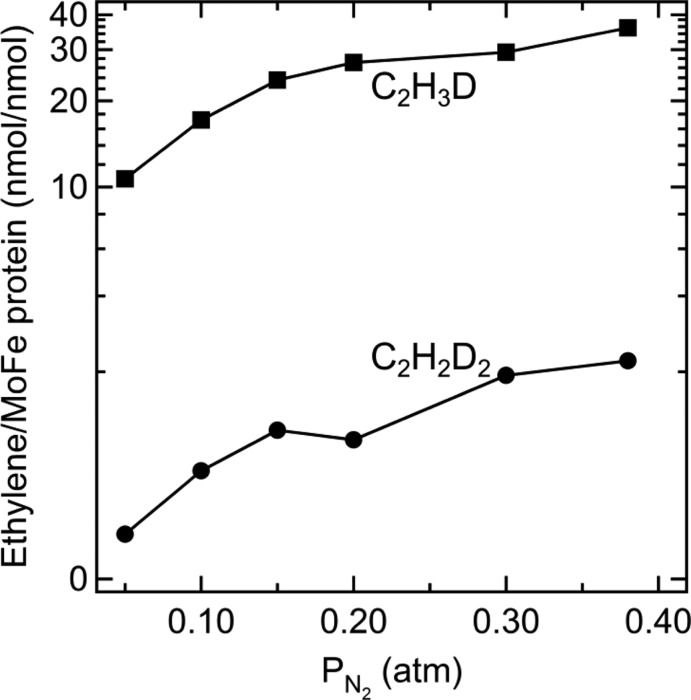
Deuterated ethylene
formation as a function of N2 partial
pressure. The partial pressure of C2H2 was 0.02
atm and D2 was 0.6 atm. The molar ratio of Fe protein to
MoFe protein was 4:1. Assay conditions as in Figure 17. Adapted with permission from ref (157). Copyright 2013 National Academy of Sciences.
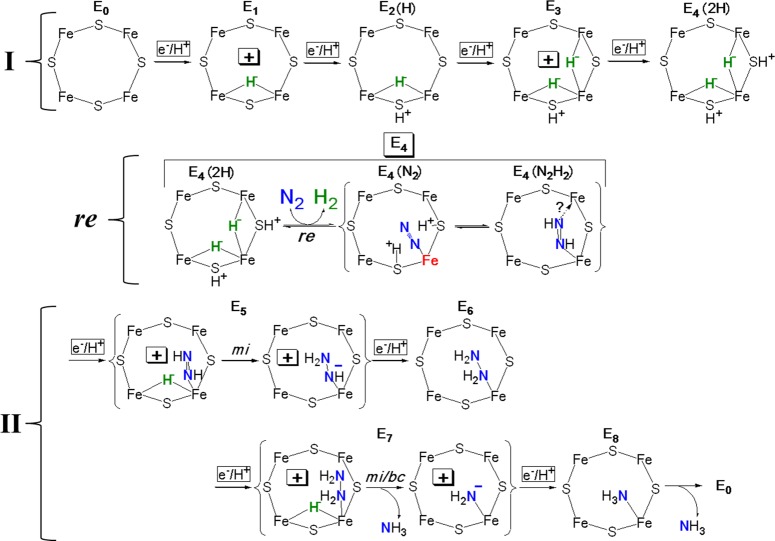
Proposed mechanism displaying structures of all intermediates
in
nitrogen fixation, inspired by the assumption of primacy of hydride
chemistry associated with the Fe2,3,6,7 face of FeMo-co, and containing
a formal description of the transformations that convert each stage
to the subsequent one. In I the mechanism tentatively adopts and visualizes
the view of En states n = 1–4 presented in Figure 6B; in II
it visualizes bridging hydrides by analogy, without evidence for or
against terminal hydrides for n = 5–7. Likewise,
the structure of the N2H2 species as end-on
bound diazene is suggestive, not definitive, etc. I and II are connected
by the re mechanism, Figure 13, lower. Formal
charges are included as useful to help guide the reader.

Models for the two alternative
modes for N2 binding
at Fe6 of FeMo-cofactor in the E4(N2) state,
with two protons bound to two adjacent sulfides as in Figure 4: (A) endo mode; (B) exo mode. The side chains of selected amino acid residues are shown
as sticks. The figure was generated in Pymol by building N2 onto the resting-state of FeMo-co using the coordinate file PDB:2AFK. Iron is shown in
rust, molybdenum in magenta, sulfur in yellow, carbon in dark gray,
hydrogen in light gray, nitrogen in blue, and oxygen in red.
References
-
- Ferguson S. J. Curr. Opin. Chem. Biol. 1998, 2, 182. - PubMed
-
- Smil V.Enriching the Earth: Fritz Haber, Carl Bosch, and the Transformation of World Food Production; MIT Press: Cambridge, MA, 2004.
-
- Jia H.-P.; Quadrelli E. A. Chem. Soc. Rev. 2014, 43, 547. - PubMed
-
- MacKay B. A.; Fryzuk M. D. Chem. Rev. 2004, 104, 385. - PubMed
-
- Canfield D. E.; Glazer A. N.; Falkowski P. G. Science 2010, 330, 192. - PubMed
Publication types
MeSH terms
Substances
Grants and funding
LinkOut - more resources
Full Text Sources
Other Literature Sources
