

Review
doi: 10.1021/cr400443z.
Epub 2014 Jan 28.
The mononuclear molybdenum enzymes
Affiliations
- PMID: 24467397
- PMCID: PMC4080432
- DOI: 10.1021/cr400443z
Item in Clipboard
Review
The mononuclear molybdenum enzymes
Chem Rev.
.
No abstract available
Conflict of interest statement
The authors declare no competing financial interest.
Figures
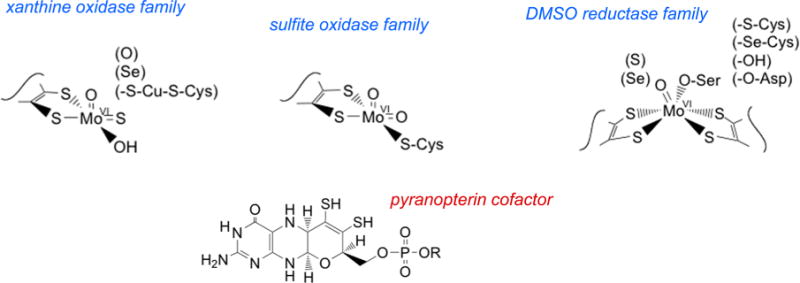
Active site structures for the three families of mononuclear molybdenum enzymes. The structures shown are, from left to right, for xanthine oxidase, sulfite oxidase, and DMSO reductase. The structure of the pyranopterin cofactor common to all of these enzymes (as well as the tungsten-containing enzymes) is given at the bottom.
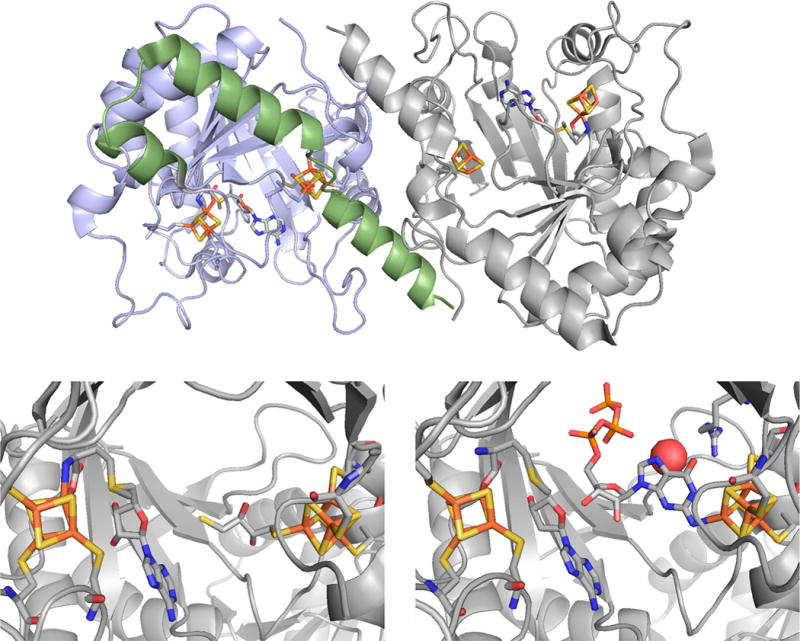
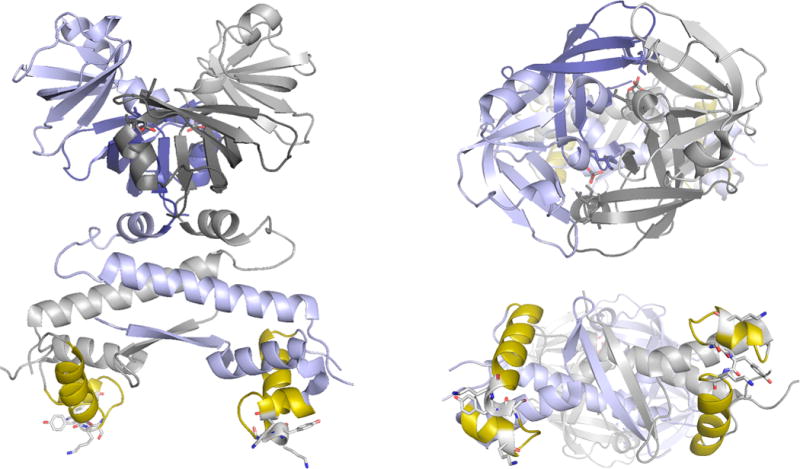
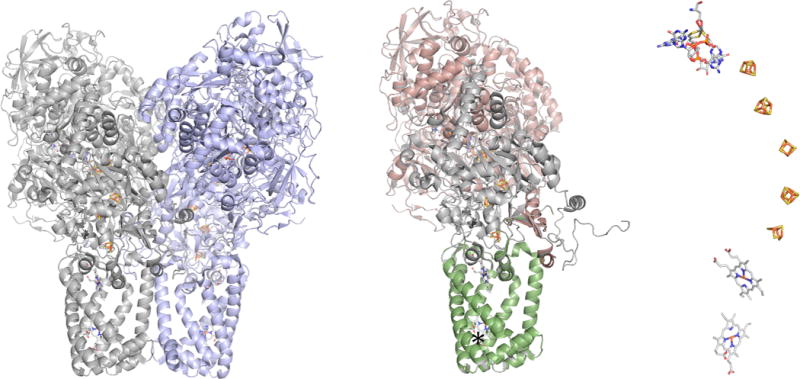
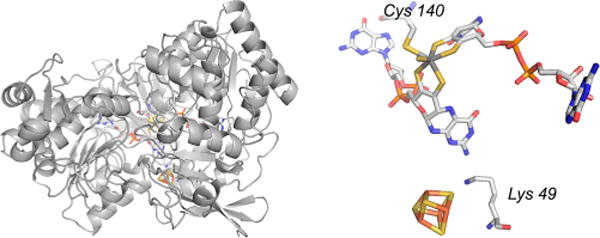
The structure of MoaA from S. aureus. Top, the structure of the dimeric enzyme, with the N- and C-terminal domains of the subunit on the left shaded in blue and green, respectively. Bottom left, a close-up of the active site with S-adenosylmethionine bound to the N-terminal [4Fe-4S] cluster and dithiothreitol bound to the C-terminal [4Fe-4S] (PDB 1TV8). Bottom right, a close-up of the active site of GTP bound to the C-terminal cluster, and methionine bound at the N-terminal cluster; 5′deoxyadenosine is also present in the active site (PDB 2FB3).
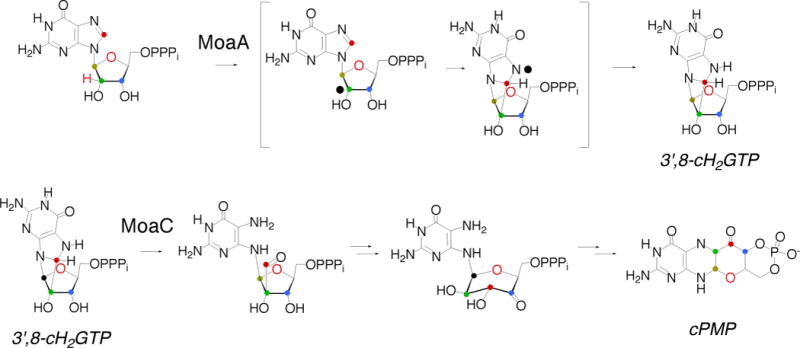
The reactions catalyzed by MoaA and MoaC. It is possible that the MoaA reaction proceeds without opening of the ribose ring.
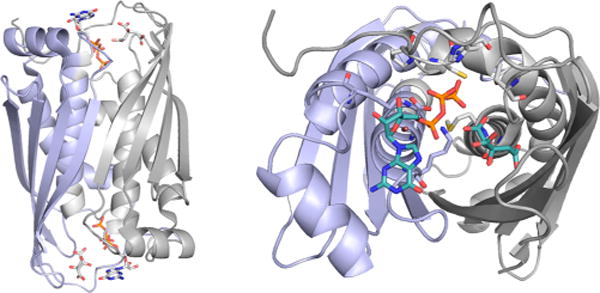
The structure of MoaC in complex with GTP and citrate (PDB 3JQM). Left, overall structure of the dimer, with the two subunits in blue and gray. The GTP/citrate binding sites are at the top and bottom. Right, a close-up of one binding site, showing the bound GTP and citrate in teal.
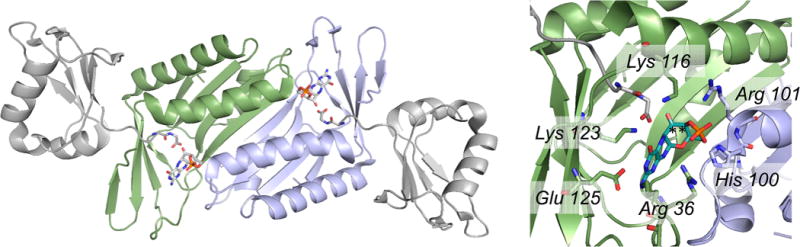
The structure of S. aureus MoaDE in complex with cPMP (PDB 2QIE). Left, the overall structure of the (αβ)2 heterotetramer, with the two MoaD subunits in gray, and the two MoaE subunits, with cPMP bound in each active site, in blue and green. The C-terminal tails of the MoaD subunits, ending in a highly conserved GG, are seen extending into the MoaD active sites. Right, a close-up of one active site showing the several amino acid residues interacting with the bound cPMP, and the proximity of the MoaD C-terminus to the positions to become sulfurated (indicated by asterisks).
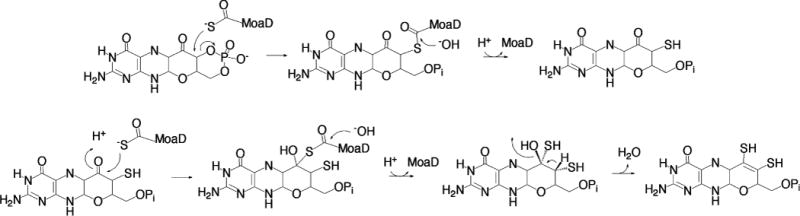
The proposed reaction mechanism of MPT synthase (after ref 16). In the second sulfuration step (bottom), the stereochemistry of the pyran ring is inferred from the spatial disposition of cPMP relative to the C-terminus of MoaD (see Figure 5).
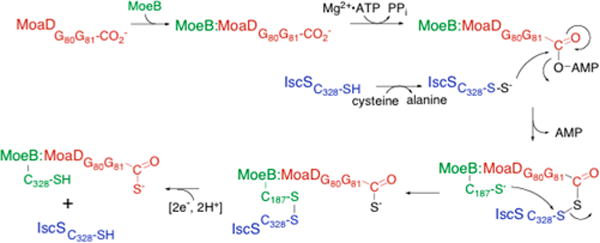
The sulfuration of the carboxy terminus of MoaD. As shown, MoaD is in red, MoeB in green, and IscS in blue. Numbering is for the E. coli system.
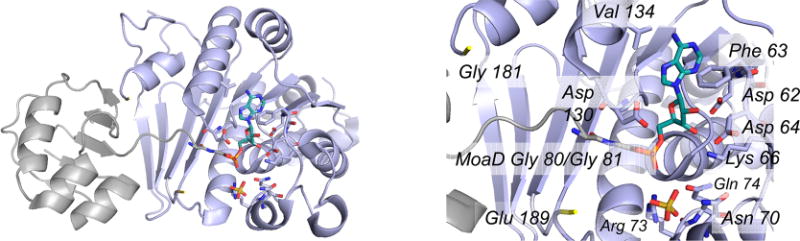
The structure of the complex of adenylylated MoaD with MoeB (PDB 1JWB). Left, one functional αβ dimer of the overall (αβ)2 tetramer, with MoeB in blue and MoaD in gray with its C-terminal GG rendered in CPK colors; the covalently attached adenylate is in teal. Residues 181 and 189 are indicated in yellow to demarcate the unresolved loop of MoeB that spans the C-terminus of MoaD (immediately above the four-stranded β-sheet at the far left of MoeB). Right, a close-up of the MoaD acyl adenylate bound in the active site of MoeB, showing amino acid residues interacting with it (including Phe 63 and Val 134, which lie on either side of the adenine, and Arg 73 that interacts with the phosphate). A sulfate ion from the crystallization mother liquor is also bound in the active site. Gly 181 and Glu 189, yellow, delimit the unresolved loop in the crystal structure that includes Cys 187.
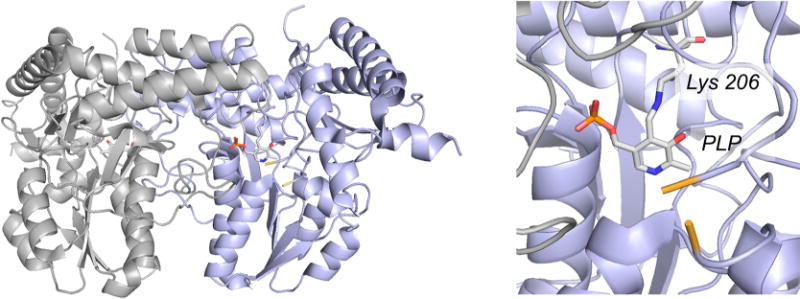
The structure of the E. coli cysteine desulfurase IscS (PDB 1P3W). Right, the overall fold of the dimer, with the two subunits shown in gray and blue and the pyridoxal phosphate rendered in CPK colors. Left, a close-up of the active site, showing the pyridoxal phosphate present as a Schiff base with Lys 206. Residues 327 and 334, which delimit the unresolved residues 328–333 (including Cys 328 that is made of a persulfide in the course of the desulfurase reaction), are shown in yellow.
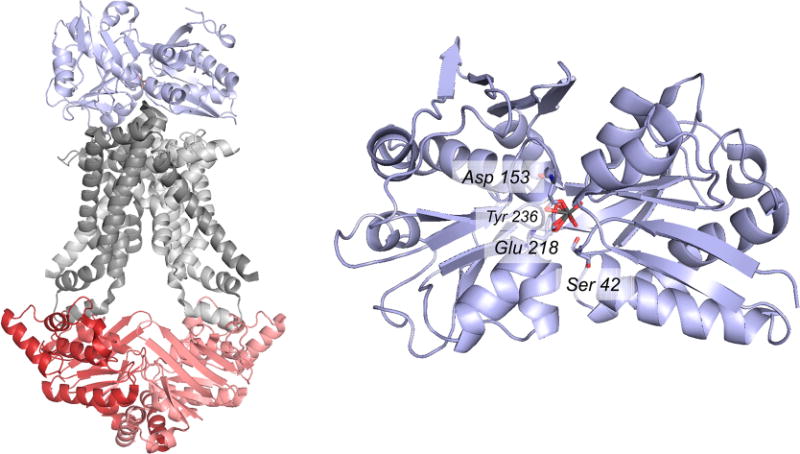
The structure of the A. fulgidus molybdate transporter (PDB 2ONK). Left, the overall structure of the ModAB2C2 heteropentamer, with ModA in blue, ModB in gray, and ModC in red; the two subunits of ModB and ModC are indicated in dark and light shading. Right, the molybdate binding site of ModA, as seen from the face that interacts with the ModB2 dimer. The anion binding site consists of Asp 153 and Glu 218, both bound in a bidentate fashion, plus Tyr 236 and Ser 42 that hydrogen bond to the bound anion (in the case of the crystal structure tungstate, rather than molybdate, from the crystallization mother liquor).
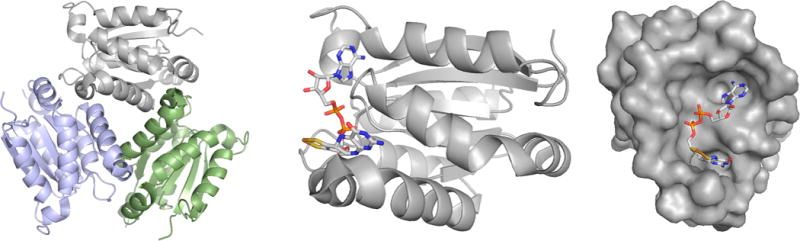
The structure of MogA homologues. Left, the common trimeric structure of the proteins, as illustrated by the G domain of human gephyrin (PDB 1JLJ). Center, a single subunit of the A. thaliana Cnx1-G domain (shown in approximately the same orientation as the gray subunit of the trimer at left), in complex with its product, the adenylylated pyranopterin cofactor (MPT·AMP). The structure is of a fully functional S583A mutant (PDB 1UUY). Right, the surface of the A. thaliana G domain showing the deep crevice in which the product binds (the orientation is rotated 90° about the vertical as compared to that seen at center).
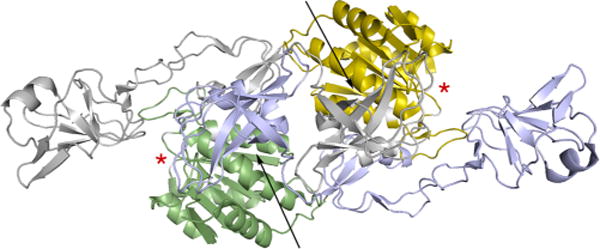
The structure of the E domain of A. thaliana Cnx1 (PDB 1G8L). One subunit of the dimer is gray, with its Cnx1-G-like subdomain III in yellow, the other blue with its subdomain III in green. The two subdomains I are at extreme left (gray) and right (blue). The presumed active sites of the two MogA-like subdomains, based on homologies to the structure for MogA complexed with MPT-AMP, are indicated by the red asterisks. The cleft between subdomains III and IV of each subunit where the β-loop of the glycine receptor binds is indicated by the arrows. In the model for full-length gephyrin proposed by Belaidi and Schwarz, the G domain of the monomer shown here in gray and yellow is assumed to occupy a position comparable that seen for the MogA-like subdomain III shown in green.
The structure of molybdate-bound ModE from E. coli (PDB 1O7L). Left, the homodimer with subunits in blue and gray. The DNA-binding helix-turn-helix is shown in yellow, with residues likely to intercalate into the DNA major groove shown protruding out from the motif. Upper right, a close-up of the molybdenum-binding C-termini, with the two equivalents of bound molybdate indicated. The two molbindin subdomains of each subunit are indicated in light and dark shading. Bottom right, the N-terminal domains, showing the DNA-binding face of the protein.
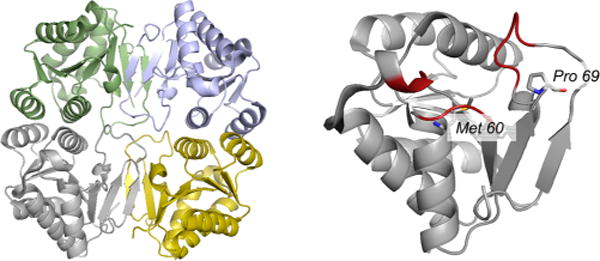
The structure of the molybdenum cofactor carrier protein from Chlamydomonas reinhardtii (PDB 2IZ6). Left, the overall architecture of the (α2)2 tetramer, with one α2 dimer in blue and green, and the other in gray and yellow. Right, an enlargement of the gray subunit at left with the region identified as the possible cofactor binding site delimited by the regions in red, including Met 60 and Pro 69.
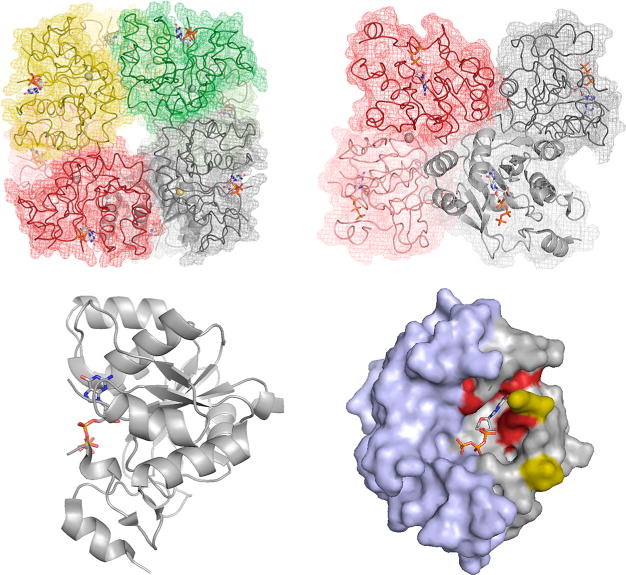
The structure of E. coli MobA in complex with GTP (PDB 1FRW). Top left, the overall arrangement of the octamer, with the zinc ions indicated demarking the subunit interface of dimers (the subunits of which are shown in dark and light shades of the same color). Bound GTP is indicated shown in CPK. Top right, a side view of the octamer, illustrating the disposition of the GTP binding sites with respect to one another. Bottom left, a ribbon representation of one subunit shown from the side. Right, a space-filling representation looking into the GTP binding site. The N-terminal nucleotide-binding domains are in gray, and the C-terminal domain that interacts with apoenzymes requiring the dinucleotide product is in blue. Residues imparting specificity for GTP as opposed to MCD are shown in red. It is to be noted that a seven-residue stretch between Lys 16 and Val 23 (yellow) is unresolved in the crystal structure, and the substrate is likely more protected from solvent than the image implies.
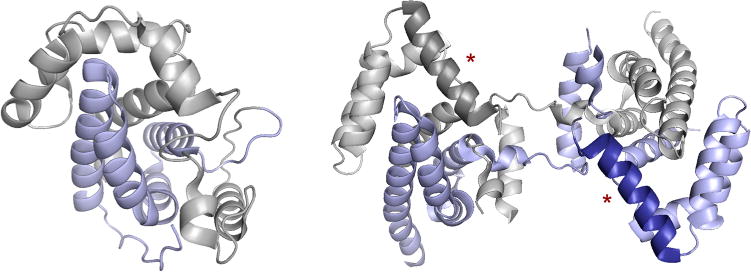
Structures of molybdenum enzyme chaperones. Left, the monomeric E. coli DmsD (PDB 3EFP), with the N- and C-terminal domains colored gray and blue, respectively. Right, the dimeric Shewanella massilia TorD (PDB 1N1C), with subunits colored gray and blue, emphasizing the unique domain swapping that has occurred. The two helices shaded more darkly (red asterisks) are implicated in binding to the core of apo TMAO reductase.
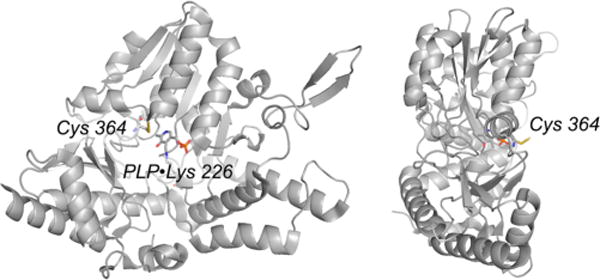
Structure of the NifS with a persulfide at Cys 364 (PDB 1KMJ). The orientation at right is rotated approximately 90° about the vertical relative to the orientation at left.
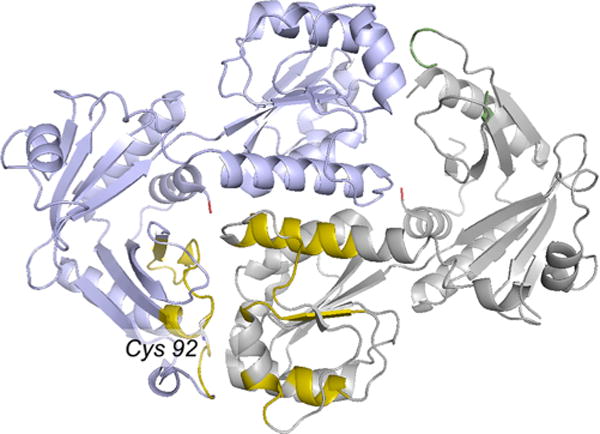
Structure of the XdhC homologue from Bacillus halodurans (PDB 3ON5). One subunit of the homodimer is in light blue, the other in gray. The putative active site cysteine 92 is at the subunit interface at lower left, surrounded by conserved regions of polypeptide as identified by Neumann and Leimkuhler in yellow. The corresponding region on the other side of the molecule is unresolved in the crystal structure.
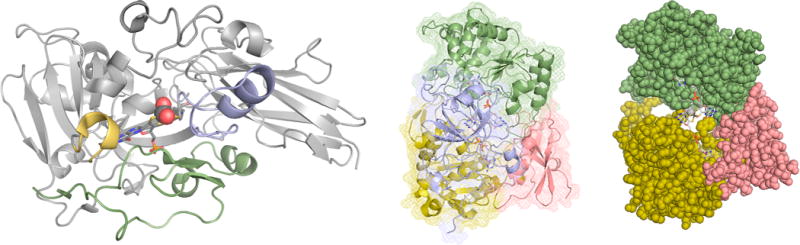
Protein structure and cofactor insertion in sulfite oxidase and TMAO reductase. Left, the backbone trace of the A. thaliana sulfite oxidase (PDB 1OGP). The structural elements shown in yellow, blue, and green are in positions that could allow them to transiently swing away in a largely folded apoprotein to accommodate the incoming cofactor. Center, the structure of S. massilia TMAO reductase (PDB 1TMO), as seen from the back of the protein opposite the substrate access funnel, with Domains I-IV in red, yellow, green, and blue, respectively. Right, a space-filling representation with Domain IV removed, exposing the enzyme’s molybdenum center from the back.
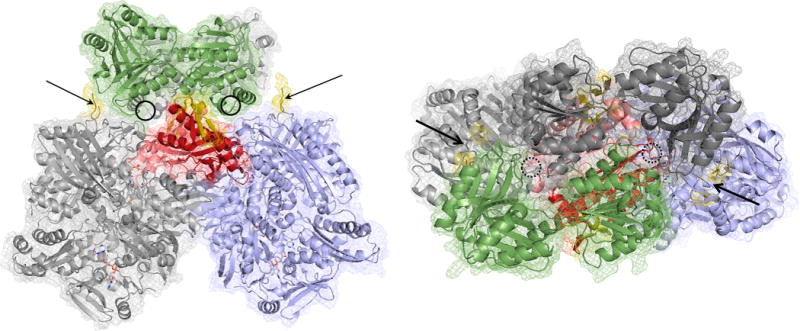
A model for the interaction between R. capsulatus xanthine dehydrogenase (PDB 2W3R) and the B. halodurans XdhC homologue (PDB 3ON5). The xanthine dehydrogenase has its two αβ protomers colored light gray and blue, with the previously identified interaction motif of each protomer in red. The redox-active centers of the dehydrogenase are rendered as CPK-colored spheres. The XdhC homologue is rendered with its subunits in dark gray and green. The insets present in the bacterial members of the xanthine oxidase family (but absent in eukaryotic members) are indicated in yellow. The general locations of the cofactor binding sites in the latter are indicated by the circles. The orientation at right is rotated 90° about the horizontal relative to that at left.
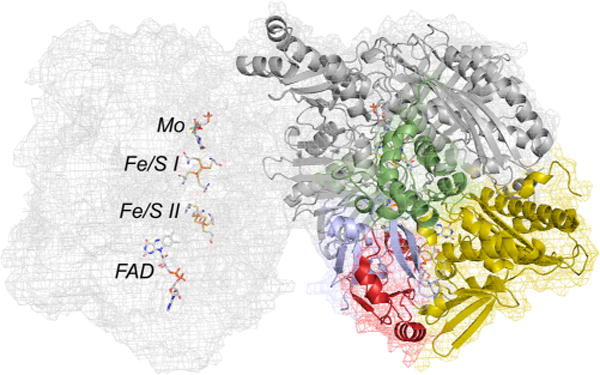
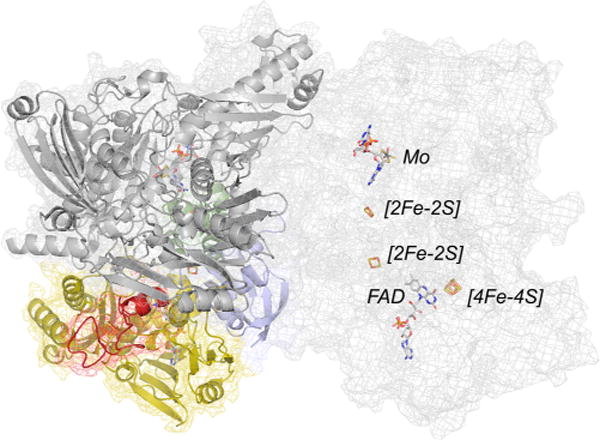
The structure of bovine xanthine dehydrogenase (PDB 1FO4). From the N-terminus in the subunit at right, the domains are colored blue and green for the two [2Fe-2S] clusters (Fe/S II and Fe/S I, respectively), yellow for the FAD, and gray for the molybdenum-binding portion of the protein. The linker region between iron–sulfur-and FAD-binding domains is in red at the bottom left of the subunit. The subunit on the left is rendered in mesh to illustrate the spatial layout of the several redox-active centers within the subunit to illustrate the electron transfer pathway Mo → Fe/S I → Fe/S II → FAD. The two molybdenum centers are 52 Å apart.
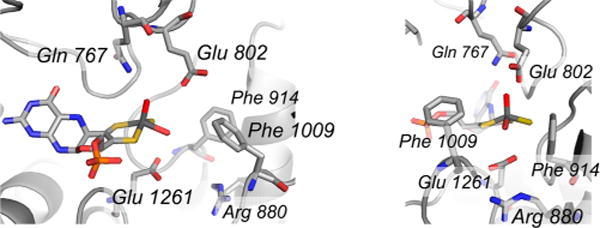
The active site of xanthine dehydrogenase (PDB 1FO4). The several active site residues referred to in the text are indicated. The orientation at right is rotated 90° about the vertical from that at left, and represents the view from the solvent access channel. The PDB file has been modified to show the catalytically essential Mo=S ligand in an equatorial rather than apical position.
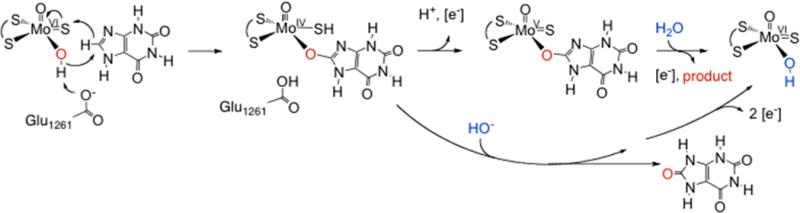
The reaction mechanism of xanthine oxidase.
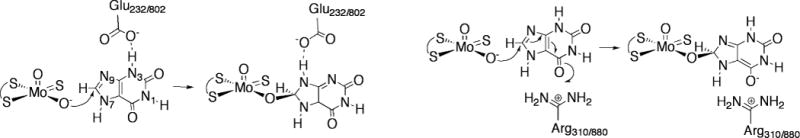
The proposed mechanism whereby Glu 232/802 facilitates tautomerization (left) and Arg 880 stabilizes charge accumulation on the C6=O of the heterocycle in the course of catalysis.
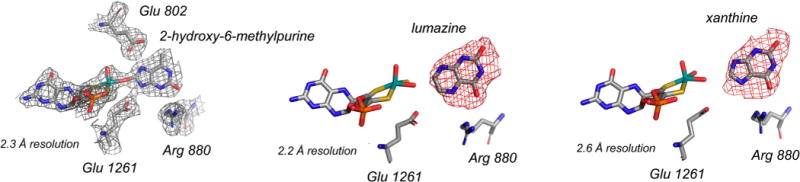
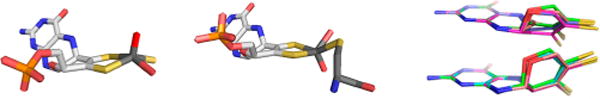
Substrate orientation in the active site of xanthine oxidase. Left, 2-hydroxy-6-methylpurine, a poor substrate (3B9J); center, lumazine, a good substrate (3ETR); and right, xanthine (3EUB).
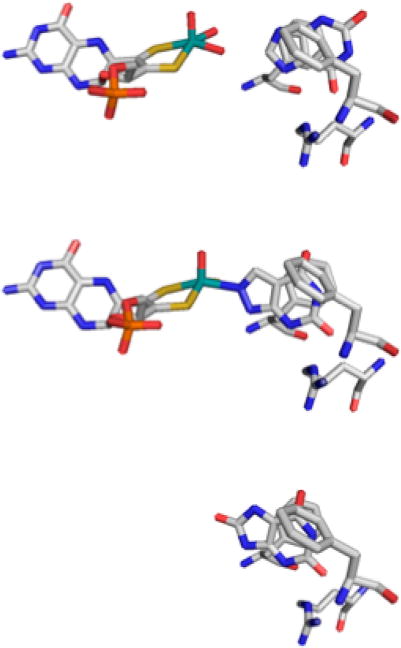
Heterocycle position in the active site of xanthine oxidase. Top, xanthine bound to desulfo bovine enzyme (3EUB). Center, alloxanthine bound to functional bovine enzyme (3BDJ). Bottom, uric acid bound to the demolybdo form of the rat D428A mutant enzyme (3AN1). A comparison clearly shows that uric acid in the bottom structure sits deeper into the enzyme (further to the left) than does xanthine in the top structure.
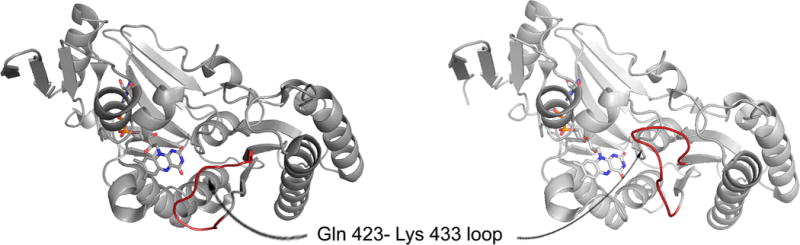
Structures of the flavin domains of the dehydrogenase (left; PDB 1FO4) and oxidase (right; 1FIQ) forms of bovine xanthine oxidoreductase. The loop that rearranges and occludes NAD+ binding upon proteolytic nicking or cysteine oxidation is indicated in red.
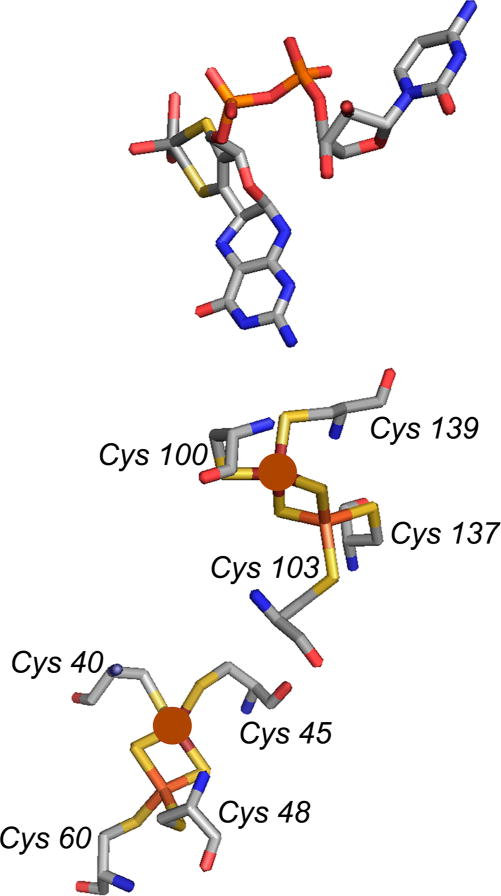
The redox-active irons in the iron–sulfur clusters of aldehyde oxidoreductase (based on PDB 1VLB). The redox-active iron in Fe/S I (that is proximal to the molybdenum center) is coordinated by Cys 100 and Cys 139, while that in Fe/S II is coordinated by Cys 40 and Cys 45 (in brown sphere).
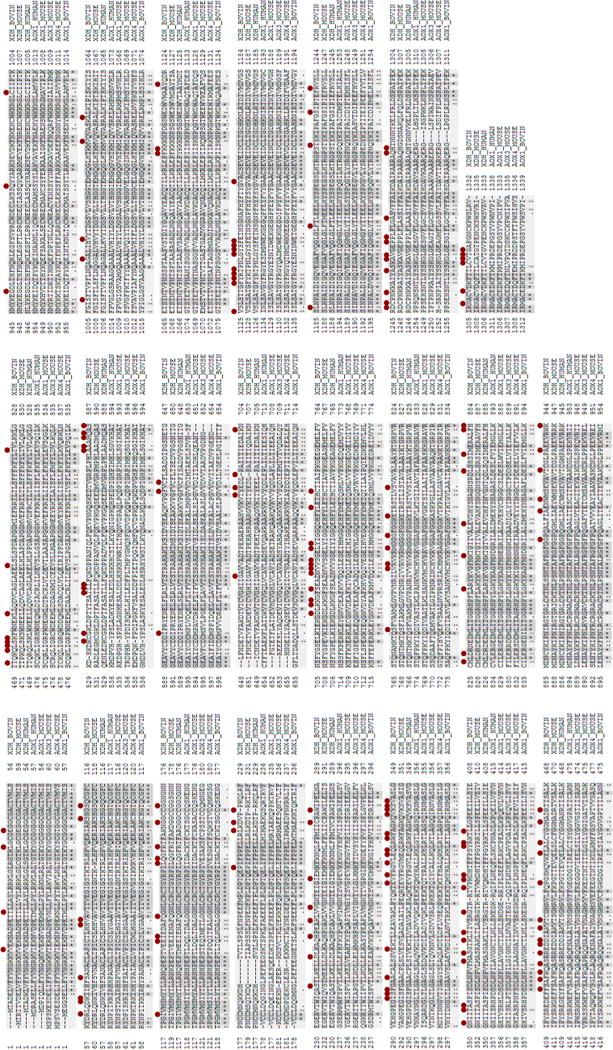
Sequence alignment of mammalian aldehyde- and xanthine-oxidizing enzymes. Conserved residues common to both subfamilies are shaded and indicated with a black asterisk or colon at below the sequences. Residues conserved within each subfamily but not between the two are indicated with a red dot.
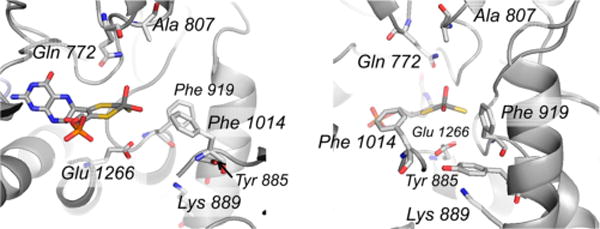
The active site of murine aldehyde oxidase 3 (PDB 3ZYV). Conserved residues with the bovine xanthine oxidase include Phe 914/919 (bovine/murine numbering), Phe 1009/1014, Glu 1261/1266, and Gln 767/772. Amino acid residues that are not conserved include Glu 802/Ala 807, Arg 880/Tyr 885 (a methionine in most other aldehyde oxidases), His 884/Lys 889, and Leu 1014/Tyr 1019. Compare with Figure 22.
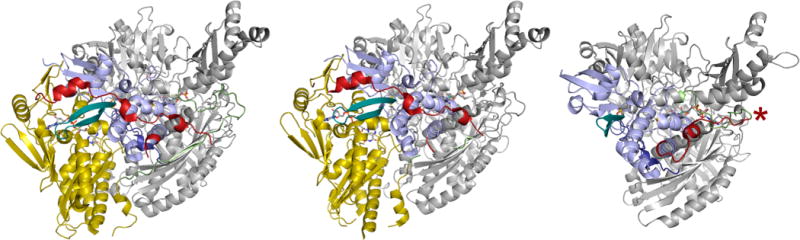
A comparison of the polypeptide trace in bovine xanthine dehydrogenase (PDB F1O4), mouse aldehyde oxidase (PDB 3ZYV), and D. gigas aldehyde oxidoreductase (PDB 1VLB). The iron–sulfur domains (of one subunit each of the homodimers) are in blue, the FAD domains (when present) are in yellow, and the molybdenum domains are in gray. The linker between the Fe/S and FAD domains in the first two structures is in red, and the linker between the FAD and Mo domains is in green. In the bacterial enzyme at right, the single linker between the Fe/S and Mo domains is in red and green, with the approximate point of insertion of the FAD domain indicated by the red asterisk (far right). The β-turn of the first Fe/S domain that is elongated in the eukaryotic enzymes is shown in teal.

Gene organization of the coxBCMSLDEFGHIK cluster of O. carboxidovorans. In addition to the structural genes coxMSL (blue), the gene cluster encodes the four membrane-associated proteins CoxB, CoxC, CoxH, and CoxK (green) and the two XdhC-like proteins CoxF and CoxI (red). CoxD (yellow) is a membrane-associated AAA+ ATPase thought to be involved in incorporation of the μ-sulfido bridge and copper of the binuclear center. Identified promoter regions are indicated as black ovals.
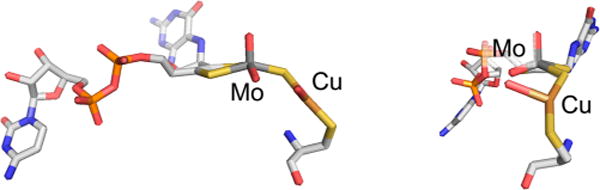
The structure of the binuclear MoVI/CuI cluster of CO dehydrogenase (PDB 1N5W). The perspective at right is rotated approximately 90° about the vertical from that at left.
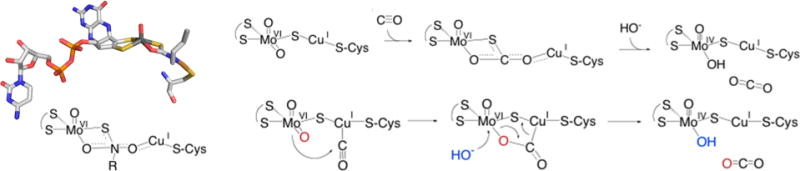
Possible reaction mechanisms for CO dehydrogenase. Left, the crystal structure (top) and model (bottom) for the n-butylisonitrile complex of O. carboxidovorans CO dehydrogenase (PDB 1N62). Upper right, a reaction mechanism proposed on the basis of the structure of the isonitrile complex; lower right, an alternate reaction mechanism based on an initial copper carbonyl complex.
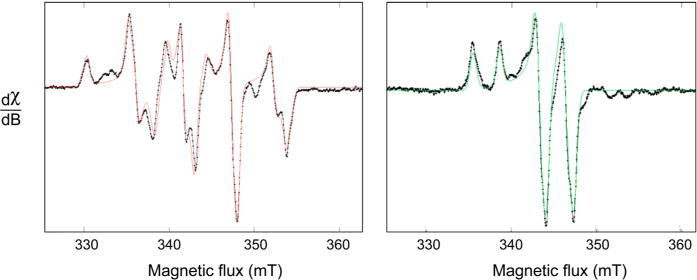
EPR of as-isolated Mo/Cu CO dehydrogenase (left) and Ag-substituted enzyme (right). Experimental spectra are in black, and simulations are in color. For the native enzyme, the fitting parameters used were g1,2,3 = 2.0010, 1.9604, 1.9549 and A1,2,3 = 117, 164, 132 MHz; for the silver-substituted, the parameters were g1,2,3 = 2.0043, 1.9595, 1.9540 and A1,2,3 = 82.0, 78.9, 81.9 MHz.
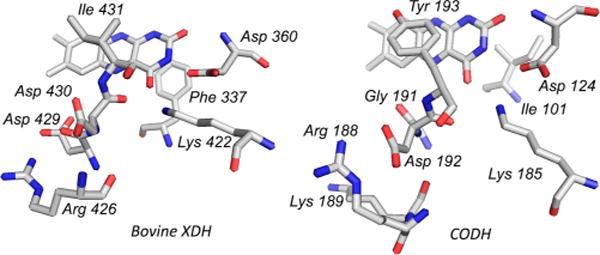
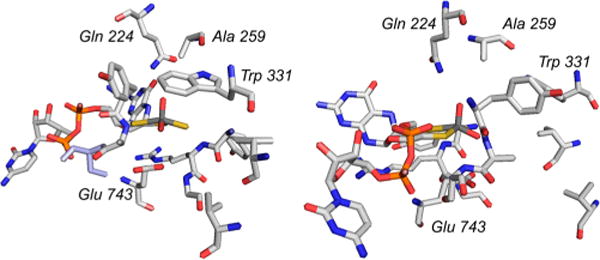
A comparison of the FAD site of bovine xanthine dehydrogenase (PDB 1FO4) and CO dehydrogenase (PDB 1N5W). Structural elements in common include the Asp/Lys pair adjacent to the pyrimidine ring of the FAD and the Asp/Arg pair below the dimethylbenzene ring. By contrast, in CO dehydrogenase the aromatic residue lies above the isoalloxazine ring and the isoleucine behind, the reverse of that seen in xanthine dehydrogenase. Also, the immediate vicinity of the dimethylbenzene is acidic in xanthine dehydrogenase, and alkaline in CO dehydrogenase.
The active site of quinoline 2-oxidoreductase (PDB 1T3Q). The amino acid residues discussed in the text are indicated.
The structure of 4-hydroxybenzoyl-CoA reductase (PDB 1RM6). The protomer at left is color coded with the two domains of the iron–sulfur-containing subunit in blue and green, the FAD-containing subunit in yellow (with the [4Fe-4S]-containing inset in red), and the molybdenum-containing subunit in gray. The protomer at right is shown in mesh so as to more clearly illustrate the disposition of the several redox-active centers with respect to one another (rendered in CPK coloring).
A comparison of conformations of molybdenum centers in members of the xanthine oxidase and sulfite oxidase families. Left, the molybdenum center of bovine xanthine oxidase (PDB 1FO4), with the apical oxo group oriented up; center, the molybdenum center of chicken sulfite oxidase (PDB 1SOX) with the apical oxo group oriented down; right, a comparison of the extent of pyranopterin distortion in representative members of the sulfite oxidase (top) and xanthine oxidase (bottom) families. After Rothery et al.
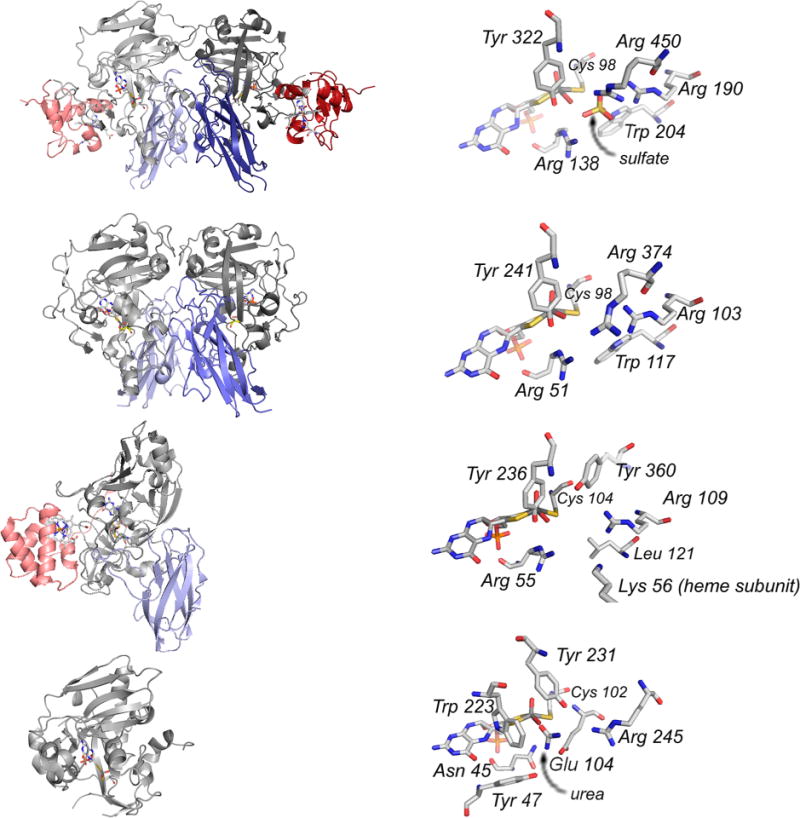
Structures of sulfite-oxidizing enzymes. From top to bottom: chicken sulfite oxidase (PDB 1SOX), A. thaliana sulfite oxidase (PDB 1OGP), S. novella sulfite dehydrogenase (PDB 2BPB), and E. coli YedY (PDB 1XDQ). Left, the overall protein folds, with heme domains/subunits in red and interface domain in blue (when present). Right, the enzyme active sites, with homologous residues labeled as discussed in the text.
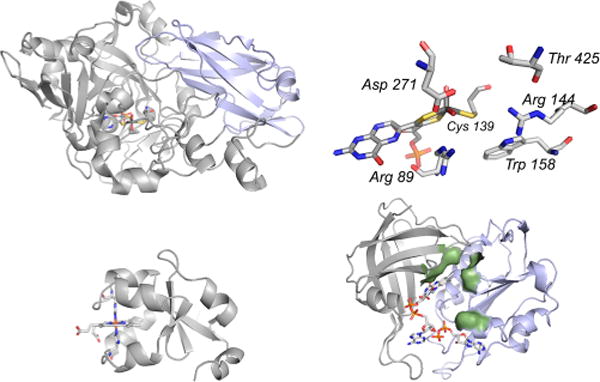
Domain structures for the assimilatory nitrate reductases. Top left, the molybdenum fragment from P. angusta (PDB 2BIH), with the dimerization domain common to the sulfite oxidases (Figure 40) in blue. Top right, the active site molybdenum center, with residues referred to in the text indicated. Bottom left, bovine cytochrome b5 (PDB 1CYO); and bottom right, the FAD fragment of Z. mays nitrate reductase (PDB 1CNF), with bound ADP to indicate the NAD+ binding site. The NAD+ binding domain is in blue.
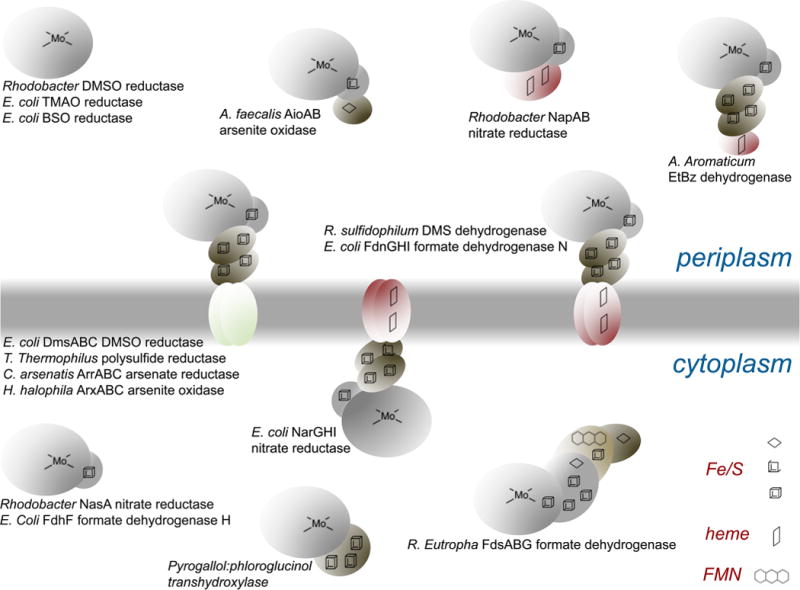
Examples of protein architectures seen for members of the DMSO reductase family of enzymes. The membrane-integral enzymes can exist as oligomers of the structures shown; only the functional protomers are indicated. A key to the types of redox-active centers found in these proteins is given at bottom right.
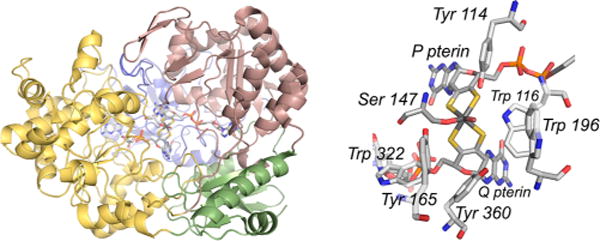
The structure of R. sphaeroides DMSO reductase (PDB 1EU1). Left, the overall fold of the protein. The four domains of the polypeptide are color-coded for clarity, with those colored yellow and red related by a pseudo two-fold axis of symmetry. The pyranopterin designated Q is associated for the most part with the yellow domain, and that designated P is with the red domain. Right, a close-up of the active, with Ser 147 coordinated to the molybdenum, and other residues of the active site as indicated.
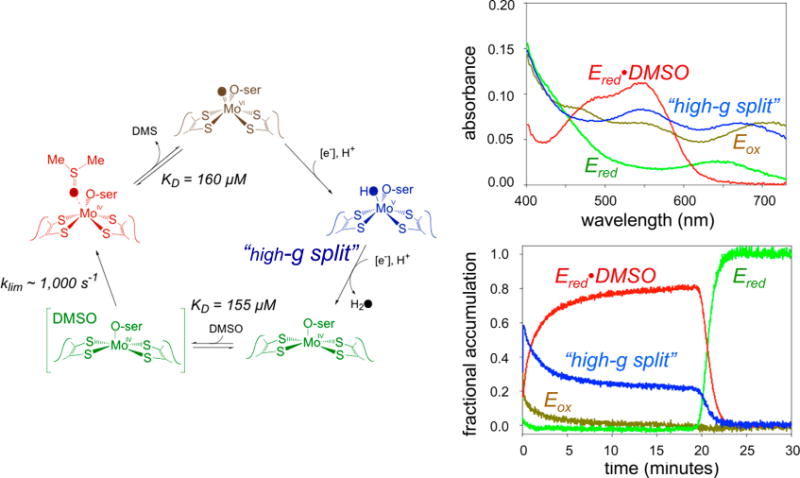
The catalytic cycle of DMSO reductase. Left, the overall catalytic cycle. Upper right, the deconvoluted absorption spectra for each of the four spectroscopically distinct species. Lower right, the time course for each species in the course of turnover with DMSO as substrate.
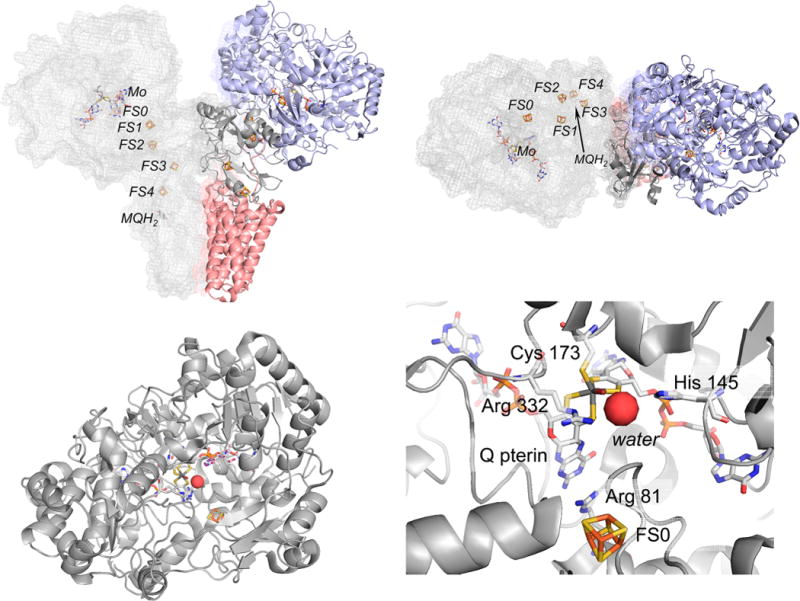
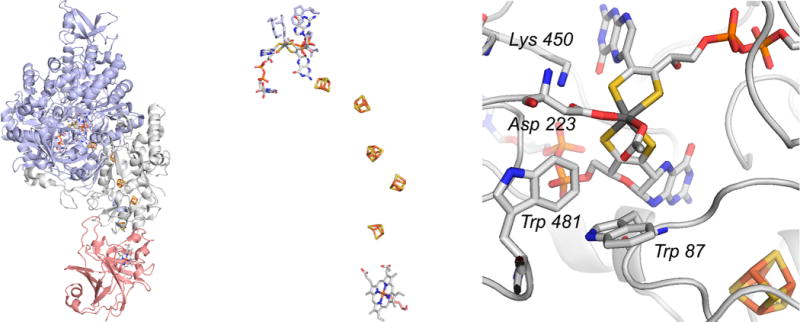
The structure of the PsrABC polysulfide reductase from T. thermophilus (PDB 2VPW). Top, the overall organization of the subunits in the (αβγ)2 oligomer. One protomer at left is in gray and shown in mesh to illustrate the disposition of the redox-active centers within the protomer, the other has PsrA, PsrB, and PsrC in blue, dark gray, and red, respectively. The orientation at right is rotated 90° about the horizontal compared to that at left. Bottom left, the PsrA subunit, looking down the solvent access channel to the active site. Bottom right, the active site molybdenum center, with Cys 173 coordinating the molybdenum and Arg 81 intervening between the Q pterin and FS0. Arg 332 and His 145 H-bond to a bound water.
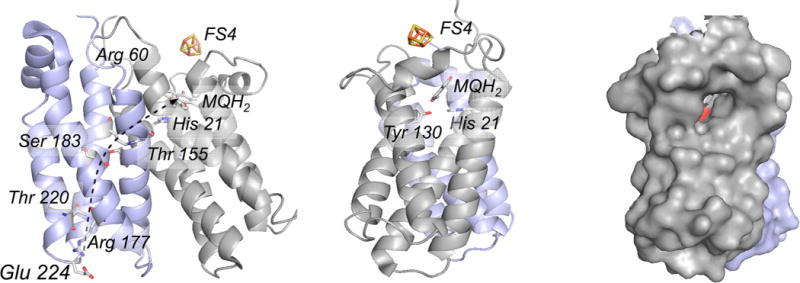
The membrane-integral PsrC subunit of T. thermophilus polysulfide reductase (PDB 2VPW). The N- and C-terminal four-helix bundles referred to in the text are shown in gray and blue, respectively. The orientation in center is rotated 90° about the vertical relative to that at left. The protein channel providing menaquinol access to the binding site is indicated at right. The proximal FS4 of PsrB is also shown, indicating its position relative to the bound menaquinol. In the orientation at left, a putative proton channel through the second four-helix bundle is indicated by the dashed arrow, involving Glu 224, Arg 177, Arg 239, Thr 220, Ser 183, and Thr 155 as shown, leading to Asp 60 and His 21 in the first bundle.
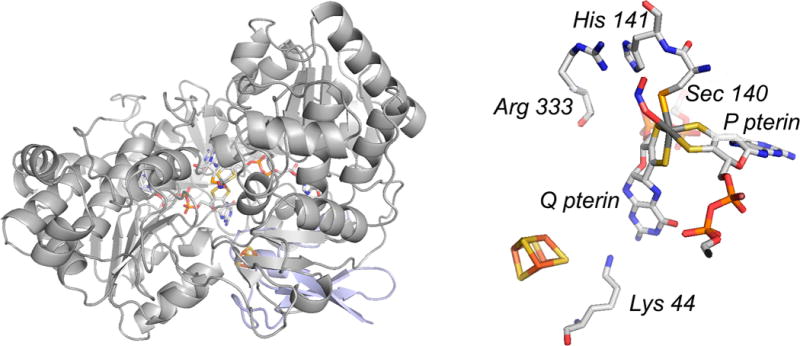
The structure of E. coli FdhF (PDB 1FDI). Left, the overall protein fold, with the N-terminal [4Fe-4S]-containing domain in blue (at rear). The orientation shown is approximately the same as that in Figure 43 for the R. sphaeroides DMSO reductase. Right, a close-up of the active site, showing the inhibitor nitrite bound at the molybdenum (displacing the hydroxide seen in free, oxidized enzyme), with Arg 333 adjacent to the molybdenum-coordinated Sec 140.
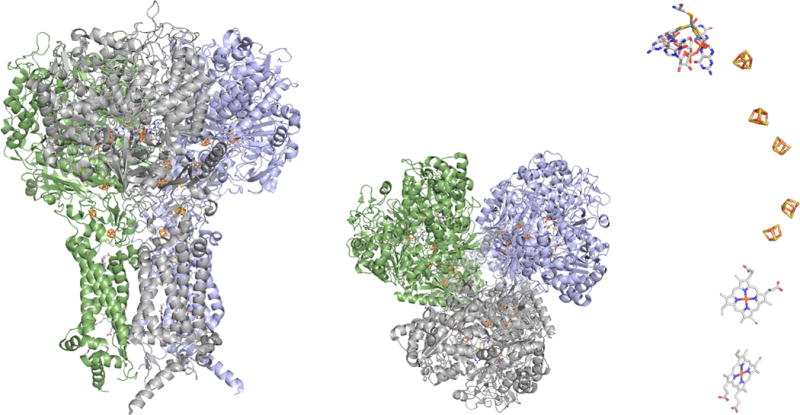
The structure of E. coli formate dehydrogenase N (PDB 1KQF). Left, a side view of the complex; center, the view from the periplasmic side of the membrane, illustrating the trimeric nature of the protein; and right, the arrangement of redox-active centers in one αβγ protomer of the enzyme, illustrating the approximately linear electron transfer chain leading from the membrane-integral hemes at bottom to the molybdenum center (site of nitrate reduction) at top.
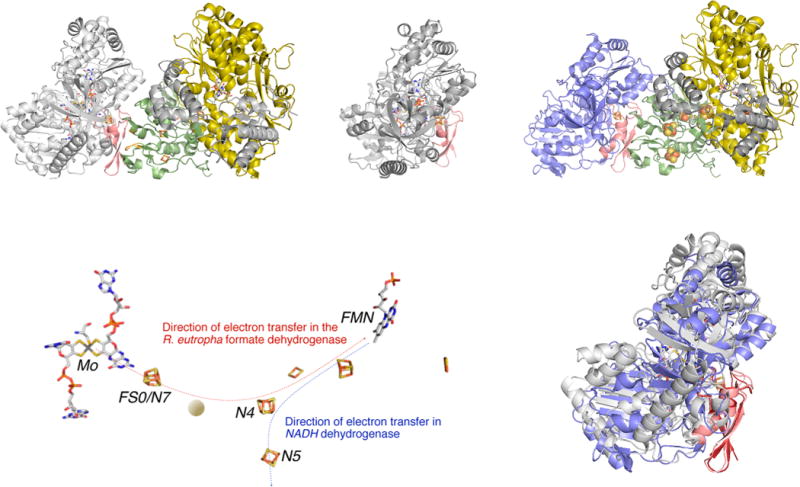
A model for the structure of the FdsGBA formate dehydrogenases. The model was obtained by superimposing the FS0 [4Fe-4S] cluster of FdhF from E. coli (PDB 1AA6) with the N7 [4Fe-4S] cluster of the Nqo3 subunit of T. thermophilus NADH dehydrogenase (PDB 3IAM), with the Nqo1 and Nqo2 subunits (which have strong homologies to FdsB and G, respectively) included in the model. Upper left, the model for FdsGBA; upper right, the structures of FdhF (with the molybdenum-binding portion of the protein in gray) and Nqo1–3 (in yellow, gra,y and green/blue, respectively), with the putative overlap region in red from which the model was constructed. This region contains iron–sulfur cluster FS0 in FdhF and N7 in the Nqo3 subunit of NADH dehydrogenase. Lower left, the disposition of the redox-active centers in the model, with the approximate position of the additional iron–sulfur cluster known to be present in the R. eutropha enzyme indicated by the orange ball. The orientation of the overall complex is the same as in upper left. Lower right, an alignment of the molybdenum-binding portion of FdhF with the C-terminal domain of Nqo3 (in blue, upper right). The rms deviation is 2.7 Å over 428 Cα atoms.
NarGHI from E. coli (PDB 1Q16). Left, the overall of the organization of the (αβγ)2 enzyme with the membrane integral NarI subunits at bottom. Center, the organization of the left-hand protomer, with the catalytic NarG in red, the iron–sulfur containing NarH in gray, and the membrane integral NarI in green. The approximate position of the menaquinol binding site near the distal heme is indicated by the asterisk. Right, the layout of the eight redox-active centers in the protomer (the perspective is rotated approximately 90° about the vertical relative to that at center).
Alternate coordination modes for Asp 222 in E. coli NarG. Left, the monodentate mode with a Mo=O ligand as seen in PDB 1R27, and right, the bidentate binding mode seen in PDB 1Q16. In both cases, the lower images are rotated about the horizontal by approximately 90° relative to the upper images.
The structure of the periplasmic Nap nitrate reductase from D. desulfuricans. Left, the overall structure (PDB 2NAP), demonstrating the close similarity in overall fold to formate dehydrogenase-H, FdhF (Figure 43). Right, a close-up of the structure of the molybdenum center in the cyanide-inhibited enzyme (PDB 2JIR).
Alternate structures proposed for the molybdenum center of Nap enzymes. Left, that originally proposed on the basis of the initial structure of the Desulfovibrio desulfuricans NapA. Right, that later suggested after examination of anomalous scattering parameters.
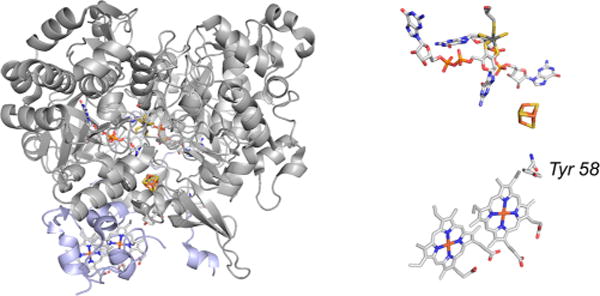
The structure of the NapAB from C. necator (PDB 3ML1). Left, the overall fold, with the molybdenum-containing NapA in gray and the diheme NapB in blue. A close-up of the redox-active centers of the enzyme (rotated approximately 45° counterclockwise about the vertical relative to the perspective at left), showing the position of Tyr 58 of NapB that intervenes between the proximal heme and [4Fe-4S] cluster of NapA.
Proposed structures of the Mo-site giving different EPR signals for the NapA nitrate reductase of P. pantotrophus.
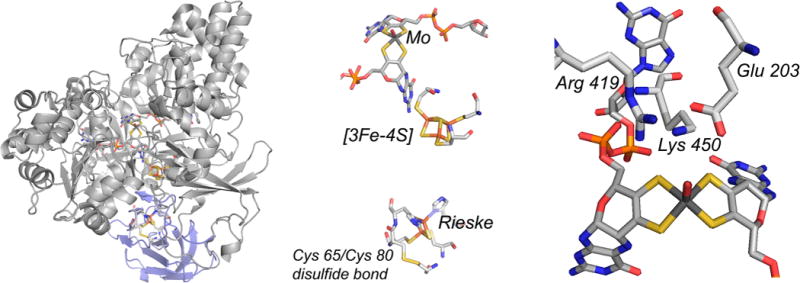
The structure of the A. faecalis AioAB arsenite oxidase (PDB 1G8J). Left, the overall fold of the dimeric enzyme, with the AioA subunit in gray and the AioB subunit in blue. Center, an enlargement of the structure from the same perspective showing the disposition of the molybdenum center (top), [3Fe-4S] cluster (center), and Rieske [2Fe-2S] cluster (bottom). Also shown is the disulfide bond between Cys 65 and Cys 80 in AioB, adjacent to the Rieske cluster. Right, the environment of the molybdenum center, showing Arg 419, Lys 450, and Glu 203 that define the substrate binding site.
The structure of ethylbenzene dehydrogenase from Aromatoleum aromaticum (PDB 2IVF). Left, the overall structure of the trimeric enzyme, with the α, β, and γ subunits in blue, gray, and red, respectively. Center, an enlargement of the enzyme’s electron transfer chain, with the molybdenum center at top and the heme at bottom. Right, the active site of the enzyme, with residues referred to in the text indicated.
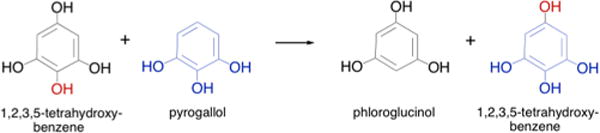
The reaction catalyzed by pyrogallol:phloroglucinol transhydroxylase.
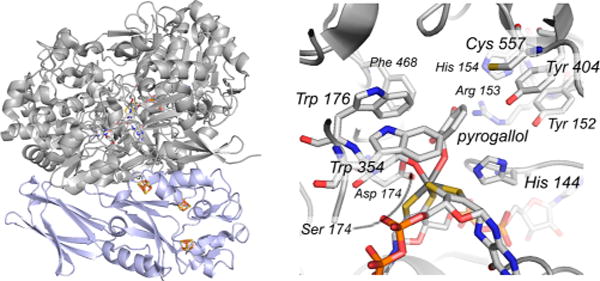
The structure of pyrogallol:phloroglucinol transhydroxylase from Pelobacter acidigallici (PDB 1TI4). Left, the large molybdenum-containing subunit is in gray, and the smaller iron–sulfur containing subunit is in blue. Right, a close-up of the active site of reduced enzyme in complex with pyrogallol.
References
-
- Derenzo EC, Heytler PG, Kaleita E. Arch Biochem Biophys. 1954;49:242. - PubMed
- Mahler HR, Mackler B, Green DE, Bock RM. J Biol Chem. 1954;210:465. - PubMed
- Nicholas DJD, Nason A, McElroy WD. J Biol Chem. 1954;207:341. - PubMed
- Cohen HJ, Fridovich I, Rajagopalan K. J Biol Chem. 1971;246:374. - PubMed
- Richert DA, Westerfeld WW. J Biol Chem. 1953;203:915. - PubMed
-
- Cvetkovic A, Menon AL, Thorgersen MP, Scott JW, Poole FL, II, Jenney FE, Jr, Lancaster WA, Praissman JL, Shanmukh S, Vaccaro BJ, Trauger SA, Kalisiak E, Apon JV, Siuzdak G, Yannone SM, Tainer JA, Adams MWW. Nature. 2010;466:779. - PubMed
- Zhang Y, Gladyshev VN. J Biol Chem. 2011;286:23623. - PMC - PubMed
- Zhang Y, Rump S, Gladyshev VN. Coord Chem Rev. 2011;255:1206. - PMC - PubMed
-
- Hille R. Chem Rev. 1996;96:2757. - PubMed
-
- Johnson MK, Rees DC, Adams MWW. Chem Rev. 1996;96:2817. - PubMed
-
- Chan MK, Mukund S, Kletzin A, Adams MWW, Rees DC. Science. 1995;267:1463. - PubMed
Publication types
MeSH terms
Substances
Grants and funding
LinkOut - more resources
Full Text Sources
Other Literature Sources
Molecular Biology Databases
