. 2014 Apr;155(4):1520-31.
doi: 10.1210/en.2013-1850. Epub 2014 Jan 27.

Sertolin mediates blood-testis barrier restructuring

Affiliations

Sertolin mediates blood-testis barrier restructuring

Michelle W M Li et al. Endocrinology. 2014 Apr.

Abstract

Two important events that occur during mammalian spermatogenesis are the release of elongated spermatids at late stage VIII of the seminiferous epithelial cycle and the restructuring of the blood-testis barrier (BTB) during stages VIII-XI. Still, it is not completely understood how these cellular events are accomplished within the seminiferous epithelium. In the present study, we investigate how sertolin, a protein that was initially identified, cloned, and partially characterized by our laboratory, functions in these critical events. Sertolin was found at the BTB, as well as at the apical ectoplasmic specialization and apical tubulobulbar complex, where it colocalized with epidermal growth factor receptor kinase substrate 8 and actin-related protein 3, two actin-regulatory proteins. Knockdown of sertolin by RNA interference showed Sertoli cell barrier function to be enhanced when assessed by transepithelial electrical resistance measurements and immunolocalization experiments. By contrast, the integrity of the BTB was disrupted when sertolin was overexpressed in vitro and in vivo. Sertolin overexpression also prompted germ cell loss from the seminiferous epithelium. Taken collectively, these results suggest that sertolin may be involved in coordinating spermatid release and BTB restructuring during spermatogenesis in the rat.


Figures

Figure 1.
Figure 1.
Sertolin is a Sertoli and germ cell protein whose localization in the rat testis is stage specific. A and B, Immunohistochemistry and immunofluorescent staining were performed by using adult rat testis paraffin and frozen sections, respectively, and antisertolin IgG (Supplemental Table 1). Sertolin localized to the BTB (red arrowheads), and apical ES and apical TBC (green arrowheads) stage specifically. Preimmune IgG served as a negative control in A. B, Fluorescent micrographs are shown as merged images. Sertolin was visualized with Alexa Fluor 555 (red fluorescence). Nuclei were visualized with DAPI (blue fluorescence). Stages of the seminiferous epithelial cycle are noted as roman numerals in A and B. Dashed curved lines in B mark the periphery of seminiferous tubules. Bar in A, 150 μm; bar in B, 50 μm. C, Immunoblot of adult testis lysate (75 μg) probed with antisertolin IgG. Sertolin, approximately 14 kDa. The relative positions of protein bands corresponding to the PageRuler prestained protein ladder (Crystalgen, Inc) are noted to the left. Mr, molecular weight. D, Immunoblots of adult testis, seminiferous tubule (S. Tubule), kidney, Sertoli (SC, isolated from 20-d-old testes), and germ (GC, isolated from adult testes) cell lysates (75 μg/lane) probed with antisertolin IgG. Sertoli (SCCM) and germ (GCCM) cell-conditioned media were also included. Actin served as a loading control. E, Histogram summarizing real-time PCR results after normalizing each data point against β-actin (Supplemental Table 2). Student's t test was performed in E. **, P < .01; n = 3 in E.
Figure 2.
Figure 2.
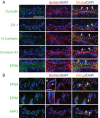
Sertolin colocalizes with BTB, apical ES, and apical TBC constituent proteins in the rat testis. A and B, Frozen sections were obtained and used for immunofluorescent staining as described in Materials and Methods and Supplemental Table 1. A, At the BTB, sertolin (red fluorescence) colocalized partially with TJ proteins occludin and ZO-1, the basal ES protein N-cadherin, the GJ protein connexin 43, and the actin-regulatory protein EPS8 (green fluorescence). Dashed curved lines in A mark the periphery of seminiferous tubules. B, At the apical ES and apical TBC, sertolin colocalized partially with EPS8, as well as with another actin-regulatory protein ARP3 (green fluorescence). Fluorescent micrographs are shown as merged images, and areas of colocalization are observed as orange-yellow in color (orange arrowheads). The insets in B are magnified views. Sertolin localized to both concave and convex sides of the elongated spermatid head (white arrowheads). Nuclei were visualized with DAPI (blue fluorescence). Bar in A, 100 μm; bar in B, inset, 10 μm.
Figure 3.
Figure 3.
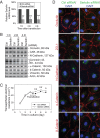
Knockdown of sertolin in Sertoli cells in vitro enhances barrier integrity. Sertoli cells (0.4 × 10⁶ cells/cm2) were transfected on day (D)3 with either nontargeting (Ctrl) or sertolin-specific siRNA duplexes, and except for the experiment shown in C, cells were harvested 1–3 days thereafter. A, Histogram summarizing real-time PCR results after normalizing each data point against β-actin (Supplemental Table 2). Data points corresponding to the Ctrl were arbitrarily set at 100%. The sertolin mRNA level decreased at all time points by approximately 75% when Sertoli cells were transfected with sertolin-specific siRNA duplexes compared with the Ctrl. B, Immunoblots of Sertoli cell lysates investigating the steady-state levels of junction and cytoskeleton proteins after sertolin knockdown (Supplemental Table 1). The 1D data point in B corresponds to day 5 in C. C, Effect of sertolin knockdown on the Sertoli cell TJ permeability barrier as assessed by TER measurements. Readings were taken daily. D, Sertoli cells previously transfected with either nontargeting or sertolin-specific siRNA duplexes, along with siGLO transfection reagent (green fluorescence), were immunostained for occludin, ZO-1, N-cadherin, α-catenin, and β-catenin (red fluorescence) (Supplemental Table 1). Nuclei were visualized with DAPI (blue fluorescence). Bar in D, 50 μm. After sertolin knockdown, an increase in ZO-1, α-catenin, and β-catenin immunofluorescence was observed at the Sertoli cell plasma membrane compared with the Ctrl. Student's t tests were performed in A and C. *, P < .05; **, P < .01; n = 4 in A and C.
Figure 4.
Figure 4.
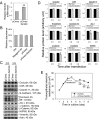
Steady-state levels of junction proteins decrease after sertolin overexpression in vitro, resulting in a disruption of barrier integrity. Sertoli cells (0.4 × 10⁶ cells/cm2) were transfected on day (D)3 with either pCIneo (Ctrl) or pCIneo-sertolin, and except for the experiment shown in E, cells were harvested 2 and 3 days thereafter. A, Histogram summarizing real-time PCR results after normalizing each data point against β-actin (Supplemental Table 2). The efficiency of the sertolin overexpression increased by approximately 50% on day 2 after transfection compared with the mock overexpression. B, Results of the XTT cytotoxicity assay. These data correspond to day 5 in E (see text below). Each treatment group consisted of triplicate wells. Results are representative of several independent readings taken at selected intervals between 4 and 24 hours after the inclusion of XTT labeling reagent, one of which is shown in B. Neither the reagent Ctrl nor transfection with pCIneo or pCIneo-sertolin affected Sertoli cell viability. Ctrl, Sertoli cells incubated without reagent Ctrl; DMEM/F12 was used instead. Absorbance readings corresponding to the Ctrl were averaged and arbitrarily set a 100%, against which all other data points were compared. C, Immunoblots of Sertoli cell lysates investigating the steady-state levels of junction and cytoskeleton proteins after sertolin overexpression (Supplemental Table 1). HSP60, heat shock protein 60. The 2D data point in C corresponds to day 6 in E. D, Histograms summarizing immunoblotting results shown in C after normalizing each data point against actin. The histogram for vimentin is not shown. Data points in A, B, and D corresponding to the Ctrl were arbitrarily set at either 1% or 100%. E, Effects of sertolin overexpression on the Sertoli cell TJ permeability barrier as assessed by TER measurements. Readings were taken daily. Student's t tests were performed in A and E; ANOVA test was performed in B. *, P < .05; **, P < .01; n = 4 in A, D, and E.
Figure 5.
Figure 5.
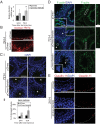
Overexpression of sertolin in vivo disrupts BTB integrity and results in germ cell loss from the seminiferous epithelium. Adult rats received intratesticular injections of plasmid DNA (pCIneo [Ctrl] or pCIneo-sertolin) as described in Materials and Methods. Rats were killed 24 or 72 hours after the last injection of plasmid DNA was administered, and testes were harvested for subsequent experiments. For BTB integrity assays, rats received dextran-TRITC via the jugular vein before being killed 1.5 hours thereafter. A, Histogram summarizing real-time PCR results after normalizing each data point against β-actin (Supplemental Table 2). B, Dextran-TRITC was observed in the adluminal compartment of the seminiferous epithelium 24 hours after the last injection of pCIneo-sertolin compared with the Ctrl. Ci, Cross-sections of testes 72 hours after the last injection of plasmid DNA stained with DAPI. Two micrographs are presented for each treatment group. Cii, Histogram summarizing results after seminiferous tubules were scored for germ cell loss. Approximately 300 tubules from each treatment group were scored for germ cell loss. D, Cross-sections of testes 72 hours after the last injection of plasmid DNA stained for F-actin. F-actin was visualized by using phalloidin-fluorescein isothiocyanate as described in Materials and Methods. Boxed areas in D correspond to magnified views. Germ cell loss from the seminiferous epithelium was observed in (Ci and D) compared with the Ctrl (asterisks). E, Immunolocalization of claudin-11 in testes 24 hours after the last injection of plasmid DNA (Supplemental Table 1). Fluorescent micrographs are shown as merged images in (D and E). Nuclei were visualized with DAPI in Ci, D, and E (blue fluorescence). Dashed curved lines in B and E mark the periphery of seminiferous tubules. Bars in Ci, D, and E, 150 μm; bar in D, inset, 15 μm. Student's t tests were performed in A and Cii. *, P < .05; **, P < .01; n = 4 for 24-hour treatment group; n = 3 for 72-hour treatment group.

Similar articles

Cited by

References

    1. O'Donnell L, Nicholls PK, O'Bryan MK, McLachlan RI, Stanton PG. Spermiation: the process of sperm release. Spermatogenesis. 2011;1:14–35 - PMC - PubMed
    1. de Kretser DM, Kerr JB. The cytology of the testis. In: Knobil E, Neill JB, Ewing LL, Greenwald GS, Markert CL, Pfaff DW, eds. The Physiology of Reproduction. New York, NY: Raven Press; 1988:837–932
    1. Oatley JM, Brinster RL. Regulation of spermatogonial stem cell self-renewal in mammals. Annu Rev Cell Dev Biol. 2008;24:263–286 - PMC - PubMed
    1. Oatley JM, Brinster RL. The germline stem cell niche unit in mammalian testes. Physiol Rev. 2012;92:577–595 - PMC - PubMed
    1. Handel MA, Schimenti JC. Genetics of mammalian meiosis: regulation, dynamics and impact on fertility. Nat Rev Genet. 2010;11:124–136 - PubMed

Publication types