. 2014 Jan 27:12:6.
doi: 10.1186/1478-4491-12-6.

The public sector nursing workforce in Kenya: a county-level analysis

Affiliations

The public sector nursing workforce in Kenya: a county-level analysis

Mabel Wakaba et al. Hum Resour Health. .

Abstract

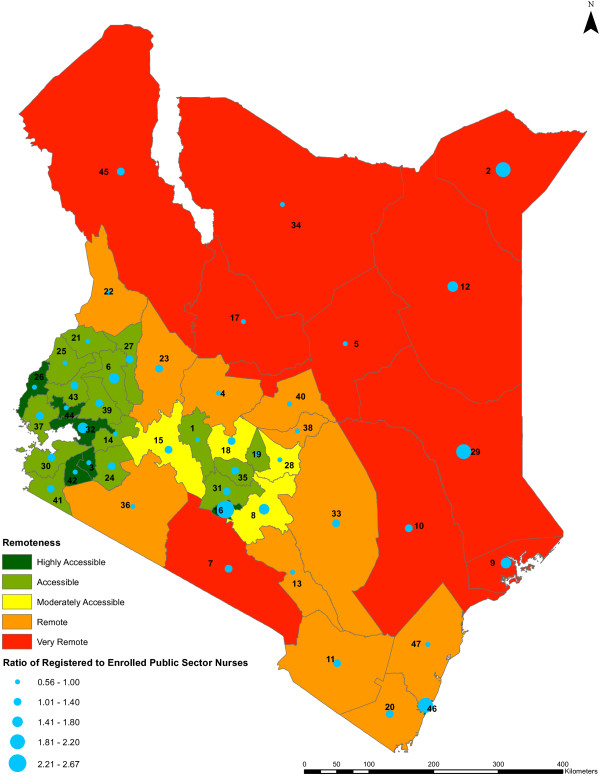
Background: Kenya's human resources for health shortage is well documented, yet in line with the new constitution, responsibility for health service delivery will be devolved to 47 new county administrations. This work describes the public sector nursing workforce likely to be inherited by the counties, and examines the relationships between nursing workforce density and key indicators.

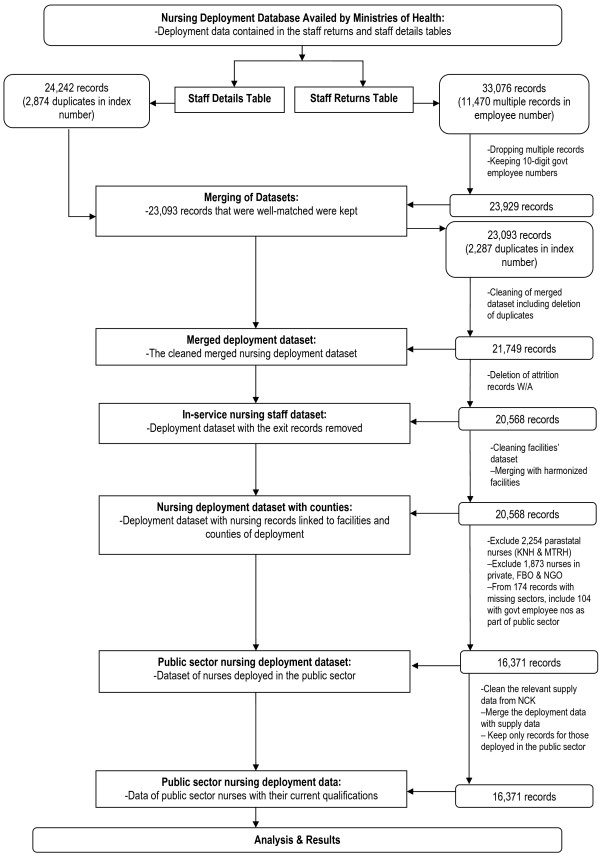
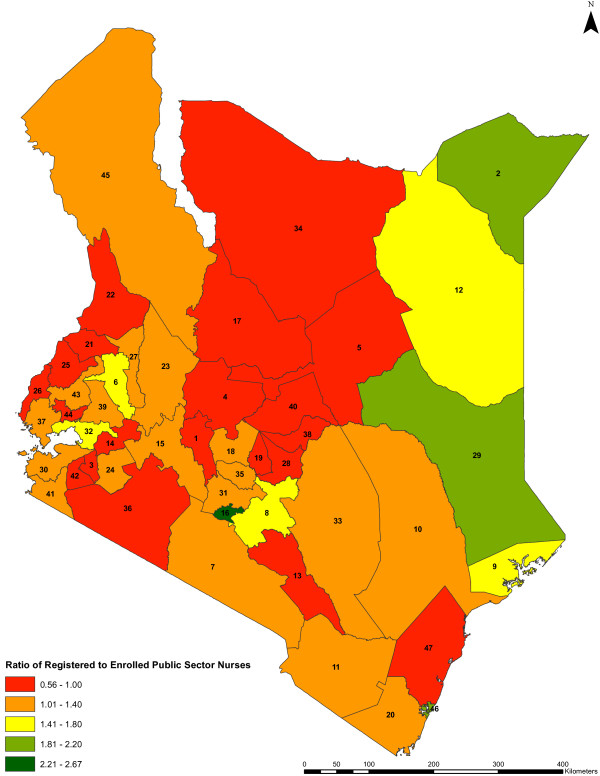
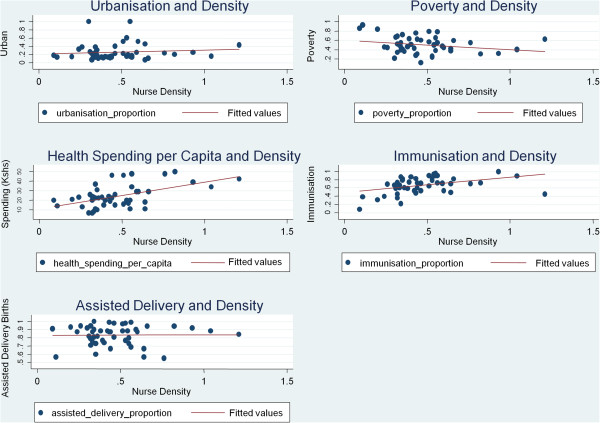
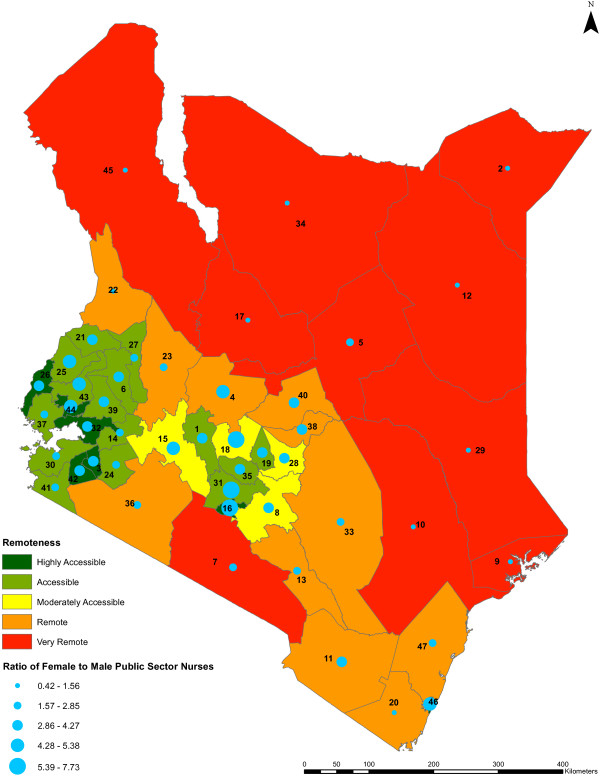
Methods: National nursing deployment data linked to nursing supply data were used and analyzed using statistical and geographical analysis software. Data on nurses deployed in national referral hospitals and on nurses deployed in non-public sector facilities were excluded from main analyses. The densities and characteristics of the public sector nurses across the counties were obtained and examined against an index of county remoteness, and the nursing densities were correlated with five key indicators.

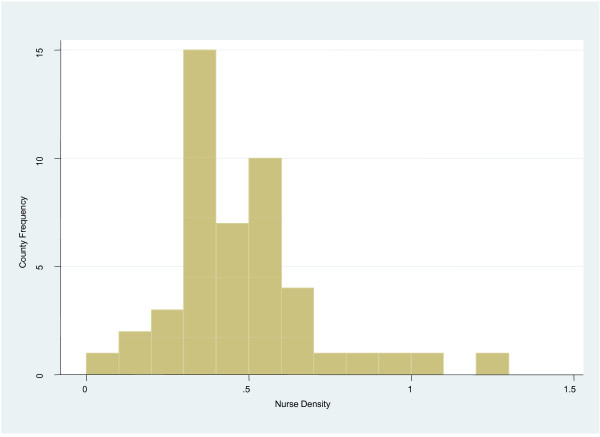
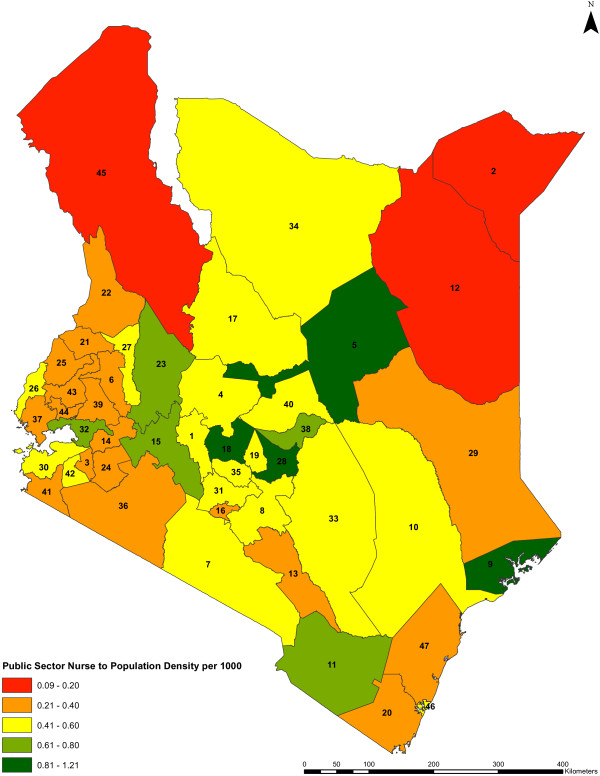
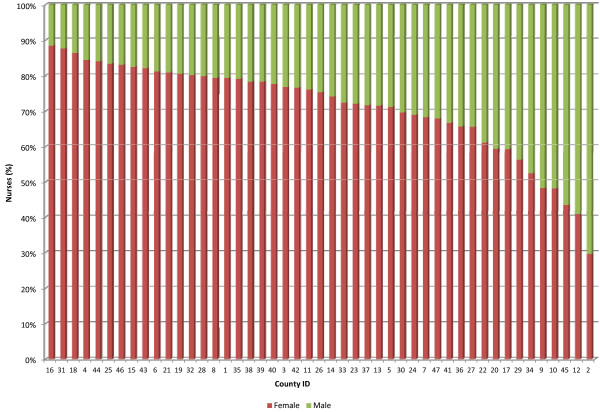
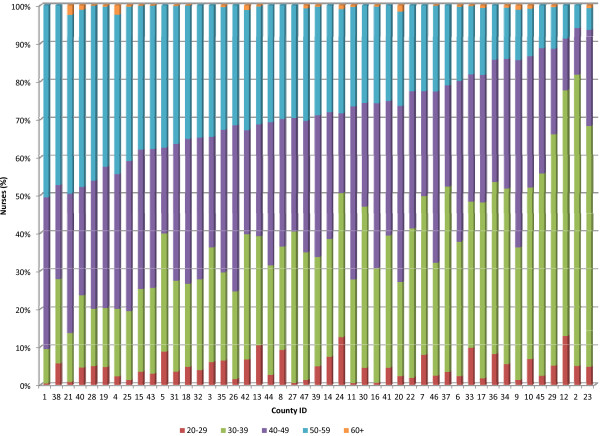
Results: Of the 16,371 nurses in the public non-tertiary sector, 76% are women and 53% are registered nurses, with 35% of the nurses aged 40 to 49 years. The nursing densities across counties range from 1.2 to 0.08 per 1,000 population. There are statistically significant associations of the nursing densities with a measure of health spending per capita (P value = 0.0028) and immunization rates (P value = 0.0018). A higher county remoteness index is associated with explaining lower female to male ratio of public sector nurses across counties (P value <0.0001).

Conclusions: An overall shortage of nurses (range of 1.2 to 0.08 per 1,000) in the public sector countrywide is complicated by mal-distribution and varying workforce characteristics (for example, age profile) across counties. All stakeholders should support improvements in human resources information systems and help address personnel shortages and mal-distribution if equitable, quality health-care delivery in the counties is to be achieved.


Figures

Figure 1
Figure 1
Methods used to obtain the public sector nursing staff data. Illustrated are the methods used to clean the data from the Ministries of Health, to extract the data on the 16,371 nurses deployed in the public sector (excluding those in national referral hospitals) and merging the same to data from the Nursing Council of Kenya so as to obtain the qualifications of the public sector nurses.
Figure 2
Figure 2
Public sector nurse density by county frequency. The frequencies of the public sector nurse to population densities across the counties (n = 47) are shown. The vertical axis of the histogram represents the county frequency while the horizontal axis represents the public sector nursing densities per 1,000 population.
Figure 3
Figure 3
Public sector nurse to population density by county. The public sector nursing densities per 1,000 population across the counties (n = 47) are shown. The colors indicate different range of values of the nursing densities for the counties, while the counties are represented by county identification numbers ranging from 1 to 47.
Figure 4
Figure 4
Gender distribution of public sector nurses by county. The proportions of female to male nurses that are deployed in the public sector across the counties (n = 47) are shown. The percentage of the public sector male nurses in each county is shown in green while the percentage of the public sector female nurses is shown in red. The counties are represented by county identification numbers ranging from 1 to 47.
Figure 5
Figure 5
Age distribution of public sector nurses by county. The proportions of the public sector nurses based on their ages are categorized into five age groups across the counties (n = 47). The age groups are mainly classified into 10-year age bands. The percentage of the public sector nurses aged 20 to 29 years in each county is shown in red, the percentage of nurses aged 30 to 39 years is shown in green, the percentage of nurses aged 40 to 49 years is shown in purple, the percentage of nurses aged 50 to 59 years is shown in blue, and the percentage of public sector nurses aged 60 years and above is shown in orange. The counties are represented by county identification numbers ranging from 1 to 47.
Figure 6
Figure 6
Ratio of registered to enrolled public sector nurses by county. The ratios of registered nurses to enrolled nurses in the public sector across the counties (n = 47) are shown. The colors indicate the different range of values of the qualification ratios in the counties, while the counties are represented by county identification numbers ranging from 1 to 47.
Figure 7
Figure 7
Public sector nursing densities against selected county indicators. The scatter plots of five selected county indicators (urbanization, poverty rates, health spending per capita, immunization rates, and delivery care provided by a skilled provider) plotted against the public sector nursing densities across the counties (n = 47) are shown, with corresponding fitted trend lines.
Figure 8
Figure 8
Public sector nurse to population density against remoteness level by county. The public sector nursing densities per 1,000 population across the counties against the remoteness levels of the counties (n = 47) are shown. The colors indicate different range of values representing the remoteness levels of the counties, from highly accessible counties being shown in dark green to very remote counties being shown in red. The nursing densities are represented by blue circles of different sizes which are based on the different range of values of the densities, while the counties are represented by county identification numbers ranging from 1 to 47.
Figure 9
Figure 9
Ratio of female to male public sector nurses against remoteness level by county. The gender ratios of female nurses to male nurses in the public sector across the counties against the remoteness levels of the counties (n = 47) are shown. The colors indicate the value ranges representing the remoteness levels of the counties, from highly accessible counties being shown in dark green to very remote counties being shown in red. The gender ratios are represented by blue circles of different sizes which are based on the value ranges of the ratios, while the counties are represented by county identification numbers ranging from 1 to 47.
Figure 10
Figure 10
Ratio of registered to enrolled public sector nurses against remoteness level by county. The qualification ratio of registered nurses to enrolled nurses in the public sector across the counties against the remoteness levels of the counties (n = 47). The colors indicate different range of values representing the remoteness levels of the counties, from highly accessible counties being shown in dark green to very remote counties being shown in red. The qualification ratios are represented by blue circles of different sizes which are based on the different range of values of the ratios, while the counties are represented by county identification numbers ranging from 1 to 47.

References

    1. Joint Learning Initiative. Human resources for health: overcoming the crisis. Cambridge, MA: Global Equity Initiative; 2004.
    1. World Health Organization. The world health report - working together for health. Geneva: World Health Organization; 2006.
    1. Blegen MA, Goode CJ, Reed L. Nurse staffing and patient outcomes. Nurs Res. 1998;47:43–50. doi: 10.1097/00006199-199801000-00008. - DOI - PubMed
    1. Harrington C, Zimmerman D, Karon SL, Robinson J, Beutel P. Nursing home staffing and its relationship to deficiencies. J Gerontol B Psychol Sci Soc Sci. 2000;55:S278–S287. doi: 10.1093/geronb/55.5.S278. - DOI - PubMed
    1. Aiken LH, Clarke SP, Sloane DM. Hospital staffing, organization, and quality of care: cross-national findings. Int J Qual Health Care. 2002;14:5–13. - PubMed

Publication types

LinkOut - more resources