. 2014 Jan 28:15:71.
doi: 10.1186/1471-2164-15-71.

Production of a reference transcriptome and transcriptomic database (EdwardsiellaBase) for the lined sea anemone, Edwardsiella lineata, a parasitic cnidarian

Affiliations

Production of a reference transcriptome and transcriptomic database (EdwardsiellaBase) for the lined sea anemone, Edwardsiella lineata, a parasitic cnidarian

Derek J Stefanik et al. BMC Genomics. .

Abstract

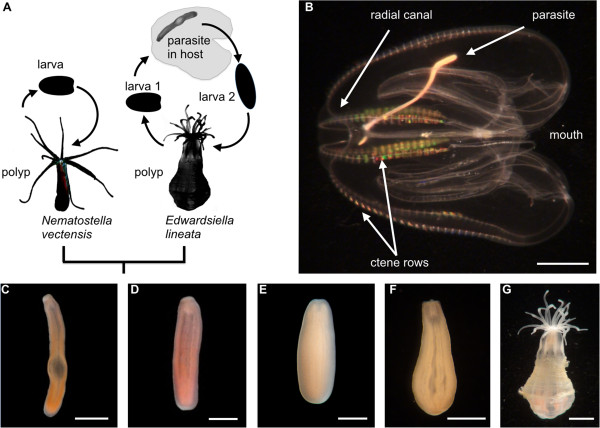
Background: The lined sea anemone Edwardsiella lineata is an informative model system for evolutionary-developmental studies of parasitism. In this species, it is possible to compare alternate developmental pathways leading from a larva to either a free-living polyp or a vermiform parasite that inhabits the mesoglea of a ctenophore host. Additionally, E. lineata is confamilial with the model cnidarian Nematostella vectensis, providing an opportunity for comparative genomic, molecular and organismal studies.

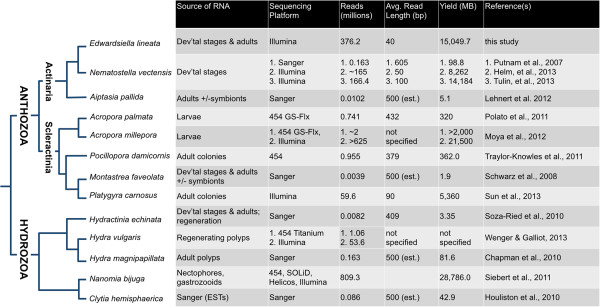
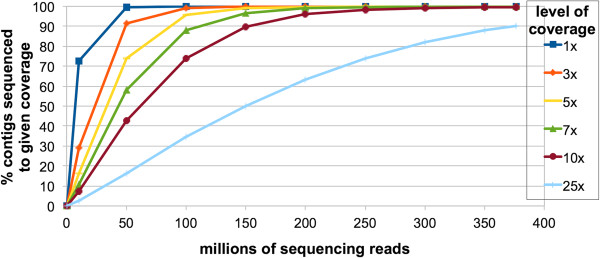
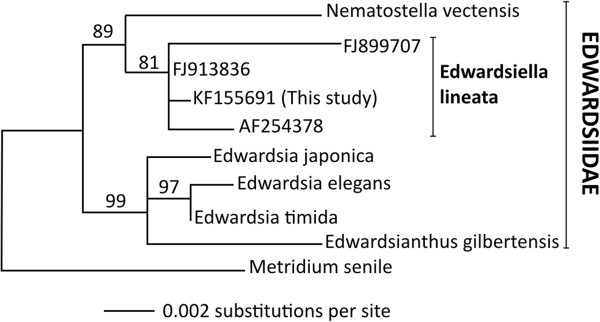
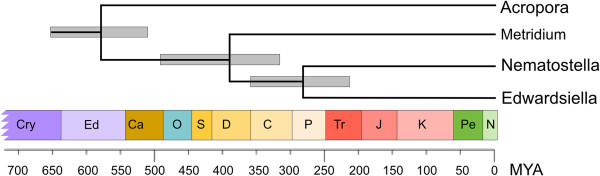
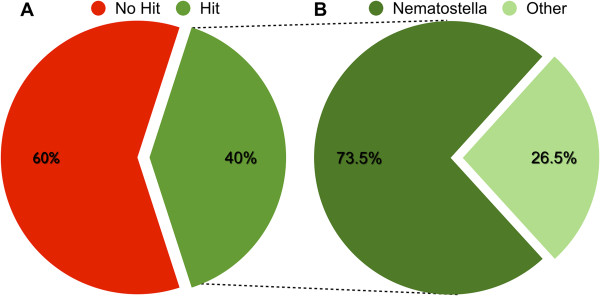
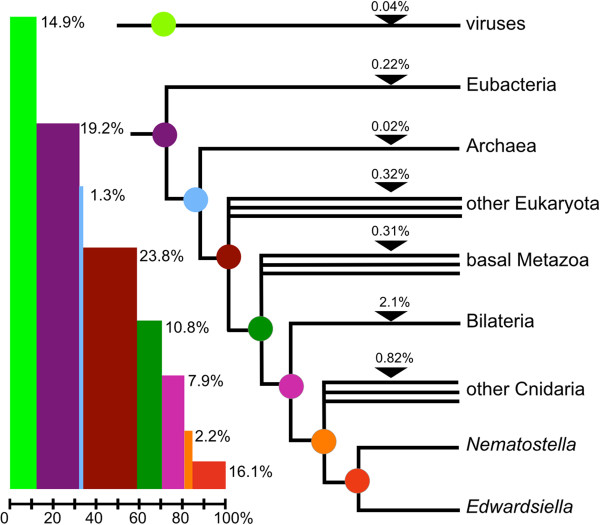
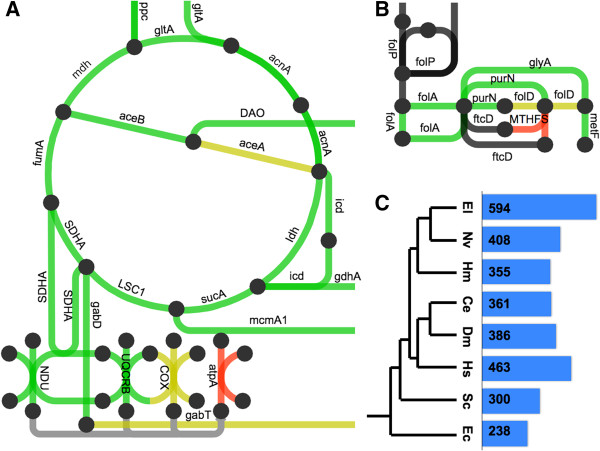
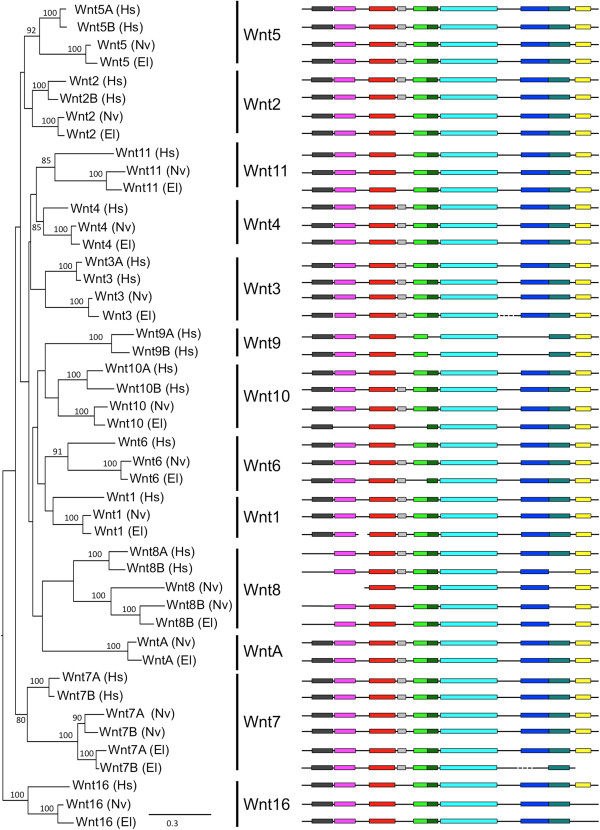
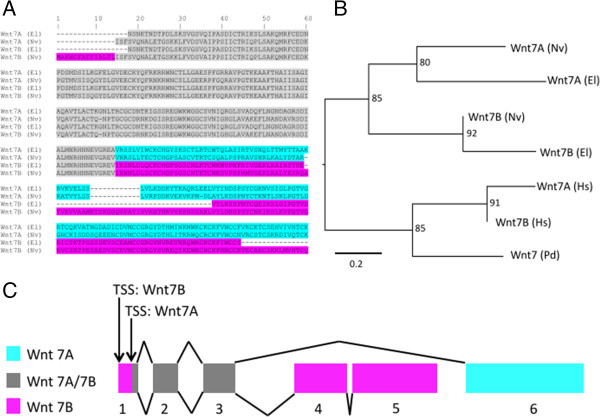
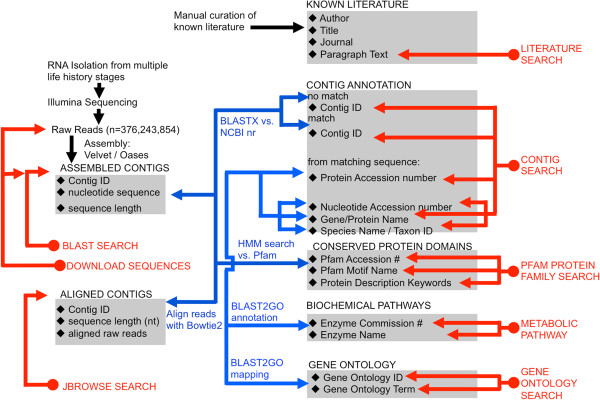
Description: We generated a reference transcriptome for E. lineata via high-throughput sequencing of RNA isolated from five developmental stages (parasite; parasite-to-larva transition; larva; larva-to-adult transition; adult). The transcriptome comprises 90,440 contigs assembled from >15 billion nucleotides of DNA sequence. Using a molecular clock approach, we estimated the divergence between E. lineata and N. vectensis at 215-364 million years ago. Based on gene ontology and metabolic pathway analyses and gene family surveys (bHLH-PAS, deiodinases, Fox genes, LIM homeodomains, minicollagens, nuclear receptors, Sox genes, and Wnts), the transcriptome of E. lineata is comparable in depth and completeness to N. vectensis. Analyses of protein motifs and revealed extensive conservation between the proteins of these two edwardsiid anemones, although we show the NF-κB protein of E. lineata reflects the ancestral structure, while the NF-κB protein of N. vectensis has undergone a split that separates the DNA-binding domain from the inhibitory domain. All contigs have been deposited in a public database (EdwardsiellaBase), where they may be searched according to contig ID, gene ontology, protein family motif (Pfam), enzyme commission number, and BLAST. The alignment of the raw reads to the contigs can also be visualized via JBrowse.

Conclusions: The transcriptomic data and database described here provide a platform for studying the evolutionary developmental genomics of a derived parasitic life cycle. In addition, these data from E. lineata will aid in the interpretation of evolutionary novelties in gene sequence or structure that have been reported for the model cnidarian N. vectensis (e.g., the split NF-κB locus). Finally, we include custom computational tools to facilitate the annotation of a transcriptome based on high-throughput sequencing data obtained from a "non-model system."


Figures

Figure 1
Figure 1
Life cycle of Edwardsiella lineata. A. A schematic comparison of the life cycles of the free-living sea anemone N. vectensis and the parasitic sea anemone E. lineata. Not drawn to scale. B. Ctenophore M.leidyi infected with parasitic E. lineata. Arrow points to parasite’s aboral end. The mouth is located near the junction of the ctenophore’s radial canals. C-G. Stages in the life cycle of E. lineata. C. An excised parasite. D. An individual undergoing the transition from the parasite to the post-parasitic larva (larva 2 in panel A). E. A post-parasitic larva. F. An individual undergoing the transition from the post-parasitic larva to polyp. G. A polyp. In panels C-G., the anemone is oriented with the mouth facing up. Scale bar: 5 mm in panel B; 2 mm in panels C,G; 1 mm in panels D-F.
Figure 2
Figure 2
Published transcriptome sequences for cnidarians. The methodology and sequencing yield for published cnidarian transcriptomes are summarized here. Taxa are arranged based on their phylogenetic relationships, as compiled from [25,28-32].
Figure 3
Figure 3
Sequencing saturation curve. The percentage of contigs with nominal coverage of n-fold (Y-axis) is plotted against the number of sequencing reads (X-axis). Sequencing sub-samples of a given size were randomly selected from the total pool of sequencing reads. Three replicates were performed for each data point. The mean value is shown. The standard error was too small to represent visually on this graph.
Figure 4
Figure 4
Phylogeny of edwardsiid 18S sequences. Maximum likelihood phylogeny of 18S rDNA sequences from 6 edwardsiid anemones and one outgroup taxon, the frilled anemone, Metridium senile. Genbank accession numbers are: Edwardsiella lineata: (1) this study: KF155691; (2) Daly et al. (2002): AF254378 [33]; (3) voucher SMNH 105142: FJ899707 [18]; (4) voucher SMNH 105141: FJ913836 [18]; Edwardsia elegans: AF254376 [33]; Edwardsia japonica: GU473304 [34]; Edwardsia timida: GU473315 [34]; Edwardsianthus gilbertensis: EU190859 [35]; Metridium senile: AF052889 [36]; Nematostella vectensis: AF254382 [18]. The length of horizontal branches is proportional to the amount of evolutionary change that is inferred to have occurred along that branch; the scale bar at the lower left indicates the number of substitutions per site. Numbers at nodes indicate support for the given clade in 1000 replicates of the bootstrap.
Figure 5
Figure 5
Estimation of the Nematostella-Edwardsiella divergence. A portion of a Bayesian phylogenetic tree, based on seven concatenated protein-coding genes and three ribosomal DNAs [37,48], used to date the divergence between Nematostella and Edwardsiella. The complete analysis comprises 87 taxa (see Methods), but the tree has been pruned so that only the anthozoan clade (corals and sea anemones) is shown. The thick gray bars at each internal node represent the 95% confidence interval for the given divergence time.
Figure 6
Figure 6
Summary of BLAST hits. A. All 90,440 contigs in the assembly were compared to sequences in NCBI’s non-redundant protein database using BLASTx, and 40% produced one or more matches to sequences in the database at a threshold Expect value of −3. B. Of the 40% percent of contigs producing BLAST hits, 73.5% had a top hit to a sequence from N. vectensis.
Figure 7
Figure 7
Inferred phylogenetic antiquity of E. lineata genes. On the basis of phylogenetically nested BLAST searches, each E. lineata contig was tentatively assigned to a particular branch of the phylogeny shown here.
Figure 8
Figure 8
Recovery of “Molecular Function” gene ontology terms. Each contig in the Edwardsiella transcriptome assembly that produced a BLAST hit was assigned a gene ontology term using Blast2GO. The same analysis was performed for the published EST sequences of N. vectensis. The recovery of possible GO terms under each of the primary subcategories of “Molecular Function” is shown here. The bars depict the total number of terms in each subcategory (gray), the number of subcategories recovered in E. lineata (dark blue), and the number of subcategories recovered in N. vectensis using a Log scale. The absolute numbers are provided on or above each bar.
Figure 9
Figure 9
Recovery of metabolic pathway components. The networks shown above depict A. the Krebs cycle, and B. the folate pathway as represented by iPath. The nodes represent metabolites, and the edges represent metabolic transformations. Green edges indicate pathways that were found in both N. vectensis and E. lineata. Red pathways were only found in N. vectensis, and yellow pathways were only found in E. lineata. Gray and black edges indicate pathways that were not found in either anemone, in the case of gray edges because no Enzyme Commission numbers map to these edges, and thus they were impossible to detect in our analysis. List of gene name abbreviations for panels A and C are as follow: gltA = citrate synthase; mdh = malate dehydrogenase; aceB = malate synthase A; DAO = D-amino-acid oxidase; aceA = isocitrate lyase; gdhA = glutamate dehydrogenase; sucA = 2-oxoglutarate decarboxylase; LSC1 = succinate-CoA ligase; mcmA1 = methylmalonyl-CoA mutase N-terminal domain; SDHA = succinate dehydrogenase complex, subunit A; gabD = succinate-semialdehyde dehydrogenase I; UQCRB = ubiquinol-cytochrome c reductase binding protein; folP = dihydropteroate synthase; glyA = serine hydroxymethyltransferase; purN = phosphoribosylglycinamide formyltransferase; metF = 5,10-methylenetetrahydrofolate reductase; MTHFS = 5,10-methenyltetrahydrofolate synthetase; ftcD = glutamate formiminotransferase; folA = dihydrofolate reductase; folD = bifunctional 5,10-methylene-tetrahydrofolate dehydrogenase; ppc = phosphoenolpyruvate carboxylase; acnA = aconitate hydratase 1; icd - isocitrate dehydrogenase; ldh = L-lactate dehydrogenase; fumA = fumarate hydratase; COX = Cytochrome c oxidase; atpA = ATP synthase subunit alpha; gabT = 4-aminobutyrate aminotransferase; NDU = NADH dehydrogenase. C. A selection of species that share ancestry with E. lineata at various evolutionary distance. The bar graph and numbers represent the amount of shared EC numbers between that species and Edwardsiella lineata. The species are E. coli, S. cereviseae, H. sapiens, D. melanogaster, C. elegans, H. magnipapillata, N. vectensis, and E. lineata.
Figure 10
Figure 10
Maximum likelihood tree of Wnt genes. The tree shown is based on a maximum likelihood analysis of an amino acid alignment of the Wnt consensus motif (PF00110). Numbers at nodes represent bootstrap values above 80%. Branch length is shown in terms of expected number of substitutions per residue (bar at lower right). Conserved motifs were identified using MEME, as described in the methods. Motifs (colored boxes) are drawn to scale, but the inter-motif regions (black lines) were altered to allow the motifs to align for ease of visualizing conservation in motif composition and order.
Figure 11
Figure 11
Wnt7 splice variants in Edwardsiella and Nematostella. A. Amino acid alignment of Wnt7A and 7B transcripts from E. lineata and N. vectensis. In the gray region, the amino acid sequence and the underlying nucleotide sequence of E. lineata Wnt7A is identical to that of E. lineata Wnt7B. Similarly, the amino acid sequence and underlying nucleotide of N. vectensis Wnt7A is identical to that of N. vectensis Wnt7B. In the regions of the alignment highlighted in blue and pink, the amino acid sequence of E. lineata Wnt7A is most similar to N. vectensis Wnt7A (blue) and the amino acid sequence of E. lineata Wnt7B is most similar to N. vectensis Wnt7B. B. A maximum likelihood phylogeny based on amino acid sequences of Wnt7A and 7B but excluding the portion of the alignment shared by E. lineata Wnt7A and Wnt7B (the region shaded in gray). Numbers at nodes indicate how many times the given clade was recovered in 1000 replications of the bootstrap. The scale bar represents the number of substitutions per site. Taxon abbreviations are as follows: El = Edwardsiella lineata; Hs = Homo sapiens; Nv = Nematostella vectensis.C. Diagram of the Nematostella Wnt7 locus illustrating the similarities and differences of the Wnt7A/7B splice variants (adapted from [66]). Wnt7A is composed of sequences from exons 1b, 2, 3, and 6, and Wnt7B is composed of exons 1, 1b, 2, 3, 4, and 5.
Figure 12
Figure 12
Conservation and loss of motifs in NF-κB proteins. Conserved protein motifs were identified using MEME. Motifs (colored boxes) are drawn to scale, but the inter-motif regions (black lines) were altered to allow the motifs to align for ease of visualizing conservation in motif composition and order. The sequences included in the analysis were the NF-κB proteins of three cnidarians (Acropora millepora, E. lineata, N. vectensis) and one sponge (Amphimedon queenslandica) as well as the NF-κB1 and NF-κB2 proteins of Homo sapiens.
Figure 13
Figure 13
EdwardsiellaBase data sources and queries.EdwardsiellaBase houses the assembled contigs that were generated in this study as well as the output from a number of bioinformatic analyses performed on them. The black diamonds indicate all of the searchable fields contained in the database’s tables (gray shading). Blue arrows indicate how the tables were populated, while red arrows indicate how the data may be queried.

Similar articles

Cited by

References

    1. Price PW. Evolutionary biology of parasites. Monogr Pop Biol. 1980;15:1–237. - PubMed
    1. Windsor DA. Most of the species on Earth are parasites. Int J Parasitol. 1998;15(12):1939–1941. doi: 10.1016/S0020-7519(98)00153-2. - DOI - PubMed
    1. Howard RS, Lively CM. Parasitism, mutation accumulation and the maintenance of sex. Nature. 1994;15(6463):554–557. doi: 10.1038/367554a0. - DOI - PubMed
    1. Lively CM. Host-parasite coevolution and sex. Bioscience. 1996;15(2):107–114. doi: 10.2307/1312813. - DOI
    1. Morran LT, Schmidt OG, Gelarden IA, Parrish RC, Lively CM. Running with the Red Queen: host-parasite coevolution selects for biparental sex. Science. 2011;15(6039):216–218. doi: 10.1126/science.1206360. - DOI - PMC - PubMed

Publication types

LinkOut - more resources