. 2014 Jan 27:2:13.
doi: 10.1186/2051-5960-2-13.

Mechanism of metabolic stroke and spontaneous cerebral hemorrhage in glutaric aciduria type I

Affiliations

Mechanism of metabolic stroke and spontaneous cerebral hemorrhage in glutaric aciduria type I

William J Zinnanti et al. Acta Neuropathol Commun. .

Abstract

Background: Metabolic stroke is the rapid onset of lasting central neurological deficit associated with decompensation of an underlying metabolic disorder. Glutaric aciduria type I (GA1) is an inherited disorder of lysine and tryptophan metabolism presenting with metabolic stroke in infancy. The clinical presentation includes bilateral striatal necrosis and spontaneous subdural and retinal hemorrhages, which has been frequently misdiagnosed as non-accidental head trauma. The mechanisms underlying metabolic stroke and spontaneous hemorrhage are poorly understood.

Results: Using a mouse model of GA1, we show that metabolic stroke progresses in the opposite sequence of ischemic stroke, with initial neuronal swelling and vacuole formation leading to cerebral capillary occlusion. Focal regions of cortical followed by striatal capillaries are occluded with shunting to larger non-exchange vessels leading to early filling and dilation of deep cerebral veins. Blood-brain barrier breakdown was associated with displacement of tight-junction protein Occludin.

Conclusion: Together the current findings illuminate the pathophysiology of metabolic stroke and vascular compromise in GA1, which may translate to other neurometabolic disorders presenting with stroke.


Figures

Figure 1
Figure 1
Vessel changes associated with encephalopathy in Gcdh−/− mice. Dilation of cerebral veins noted near circle of Willis on underside of Gcdh−/− mouse brain after protein diet exposure (a, black arrow). Brief Evans blue injection highlights arterial vessels of the circle of Willis (a, white arrow). b Section though cortex at Bregma −2.76 shows dilated left cerebral vein occupying entire space between hippocampus and thalamus (b, red arrow) with standard diet Gcdh−/− control for comparison (c). d and e shows dorsal aspect of thalamus with overlying cortex and hippocampus removed. Note extreme dilation of internal cerebral veins (e, red arrow) and great vein of Galen (e, black arrow) with normal appearing posterior cerebral artery branch marked with Evans blue injection (e, blue arrow). Vein of Galen is barely visible at this magnification in standard diet Gcdh−/− control (d, red arrow). f Perfusion fixed sections of Gcdh−/− mouse brain 36-hours after protein diet exposure shows venous congestion below hippocampus with extrusion of blood into CA3 pyramidal cell layer (arrow). g Perivascular collection of red blood cells outside endothelial layer (thick arrow). Note normal appearing vessel in same region (thin arrow). h and i Striatal sections of immersion fixed brain show congestion of larger “non-exchange” vessels (white arrows, venuole h and artery i). (e-g, Hematoxylin & eosin of perfusion fixed brain, scale bars = 200 μm).
Figure 2
Figure 2
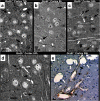
Neuronal swelling impinges on brain capillaries. Perfusion fixed brain sections from Gcdh−/+ control (a) show normal cortical neuropil and capillary morphology (black arrows). bGcdh−/− mice maintained on a standard diet show small lucent regions outside capillaries (black arrows). c After 24-hours of protein diet, lucent regions become more pronounced (black arrows) associated with swelling and edema of cortical axons (white arrows). dGcdh−/− cortex shows vacuoles filling axon of large cortical neuron (white arrows) impinging on capillaries (black arrows) with some showing stasis at 24-hours. e Section of cortex from Gcdh−/− mouse 36-hours after protein diet showing large vacuoles (white arrows) impinging on blood vessel (black arrows) surrounded by astrocyte end-feet labeled with GFAP. (sections prepared by perfusion fixation, e – labeled for GFAP with DAB staining, counterstained with toluidine blue, scale bar = 10 um).
Figure 3
Figure 3
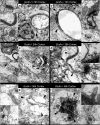
Ultrastructural vessel changes. Normal capillary morphology with surrounding astrocyte end-feet (arrow heads), neuronal projections, identified by synapses (white arrows), and myelinated axons (black arrows) of Gcdh−/+ (a) and Gcdh−/−(b) mouse cortex after 72 and 12-hours of protein diet exposure, respectively (see insets for enlargement of indicated sections). c Compressed capillary lumen surrounded by edematous myelinated axons (thick black arrows) and dendrites (white arrows) with swelling mitochondria (thin black arrows) of Gcdh−/− mouse 24-hours after initiation of protein diet. Note intact astrocyte process with nearly normal morphology (*) touching basal lamina of capillary lumen (arrowhead). d Multiple edematous dendrites, identified by synapses (white arrows) and synaptic vesicles expand in proximity to capillary lumen with adjacent astrocyte end-feet (arrowheads). e Compressed capillary surrounded by swollen astrocyte end-feet (black arrowheads) and edematous neuronal projections identified by synapses (white arrows) both with swollen mitochondria. f Severely compromised capillary lumen in Gcdh−/− mouse cortex at 48-hours of protein diet exposure surrounded by edematous dendrites identified by synapses (white arrows) and multiple swollen mitochondria (thin black arrows) with compressed astrocyte end-feet (black arrowheads). (Perfusion fixed for EM, scale bar = 1 um).
Figure 4
Figure 4
Bilateral ischemia and vessel changes in Gcdh−/− mouse brain after protein diet exposure. Comparison of Gcdh−/+ and Gcdh−/− whole brain profile (a and f) with magnified cortical surface (inset), dorsal surface (b and g) and coronal section (c and h) with magnified areas of cortex (d and i) and striatum (e and j) both placed on the protein diet for 72 and 36-hours respectively. Evans blue injection shows normal vessel morphology with complete and smooth filling of cerebral vessels in Gcdh−/+ mouse. Inset (a) shows magnification of middle cerebral artery branch (blue arrow) and pial veins (red arrows). Ischemia is noted as lack of blue staining (black arrows) in profile (f) and bilaterally on dorsal view (g) and coronal section (h) of Gcdh−/− mouse. Inset (f) shows incomplete filling of middle cerebral artery branch (blue arrow) and differential filling of pial vein branches (red arrows). Magnified areas of cortex and striatum (i and j) show prominence of non-exchange vessels (>10 μm, white arrows) venous congestion (red arrows) and differential filling of return vessels (black arrows). (Evans blue protocol detailed in methods, scale bar = 100 μm).
Figure 5
Figure 5
Microscopic perfusion changes. Evans blue perfusion shows normal capillary bed network in cortex (top row) and striatum (bottom row) of Gcdh−/+ control after 72-hours of protein diet and Gcdh−/− mice on standard diet. Note normal appearance of striatal arteries (black arrows). After 36-hours of protein diet, Gcdh−/− mice show loss of capillary bed perfusion with continued filling of larger non-exchange vessels. Note dilated striatal arteries (black arrows) and veins (white arrows). After 48-hours of protein diet exposure, capillary bed perfusion is limited with prominence of larger non-exchange vessels. Note continuity between non-exchange vessels in cortex (arrows) and increased background signal indicating permeability (scale bars = 200 μm). Bar graph) Gcdh−/− mouse brain samples from cortex (Ctx), striatum (Str), hippocampus (Hip) and cerebellum (Cer) were evaluated for Evans blue concentration after standard (SD) or high protein (Pro) diet compared to Gcdh−/+ control. (± S.E.M, * p < 0.05 compared to Gcdh−/+, # p < 0.05 compared to Gcdh−/− SD, n = 4 per group).
Figure 6
Figure 6
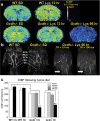
Magnetic resonance angiography and perfusion.Gcdh−/− and WT mice underwent MR perfusion-weighted imaging and angiography before and after lysine diet exposure. a Representative images showing index of cerebral blood flow (ICBF) as colorimetric scale (0–600 ml/100 mg tissue/ min). After 72-hours of lysine diet exposure, Gcdh−/− mouse shows reduced ICBF bilaterally in the striatum (ICBF < 300 ml/100 mg tissue/min). After 96-hours, Gcdh−/− mouse has globally reduced ICBF (< 200 ml/100 mg tissue/min). b Normal visualization of circle of Willis, with vertebral (VA), basilar (BA), posterior (PCA), middle (MCA) and anterior (ACA) cerebral arteries from bottom up in WT and Gcdh−/− mouse on a standard diet (SD). Complete loss of signal in Gcdh−/− mouse brain is noted after 96-hours of lysine diet using standard acquisition time (19 ms). Note signal from carotid arteries (large arrow) and circle of Willis (small arrow). Using 5-fold longer acquisition time (100 ms) a small area of the posterior circulation is visible just above the carotid arteries (large arrow). c Quantitative ICBF changes were significant in cortical and striatal ICBF in WT (n = 4) and Gcdh−/− mice (n = 5) following lysine diet exposure (* p < 0.05 t-test, **p < 0.05 ANOVA with repeated measures).
Figure 7
Figure 7
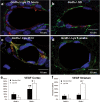
Confocal microscopy of bloodbrain barrier. Cortical sections of perfusion fixed brain from Gcdh−/− and heterozygous (Gcdh−/+) mice were fluorescently labeled for astrocytes with GFAP (green), occludin (red) and nuclei with DAPI (blue). aGcdh−/+ mouse cortex shows astrocyte end-feet (green) outlining larger blood vessel with complete ring of occludin between endothelial cells representing intact blood brain barrier. b Similar section of Gcdh−/− mouse on a standard diet (SD) showing incomplete ring of occludin at blood–brain barrier. c Within 36-hours of lysine diet exposure in the Gcdh−/− mouse, occludin is no longer between endothelial cells and appears to be withdrawn from the vessel lumen. d After 6-weeks of lysine diet exposure in Gcdh−/− mice, signal from occludin is not detectable at blood–brain barrier. e and f VEGF was significantly increased in cortex of Gcdh−/− mice compared to control and further increased after 36-hours of high lysine diet in cortex (e) and striatum (f). (± S.E.M, ** p < 0.05 compared to standard diet control, * p < 0.02, n = 3-4 per group).
Figure 8
Figure 8
Mechanism of metabolic stroke. Metabolic dysfunction associated with glutaric acid production and accumulation results in mitochondrial energy failure with secondary failure of Na/K ATPases and edema initially of neurons and neuronal projections (1). Neuronal expansion impinges on capillary blood vessels leading to ischemia, which compounds and expands regions of neuronal swelling. Compression of capillaries leads to shunting of blood to non-exchange vessels with early filling and dilation of the deep venous system (2). Lack of valves in cerebral veins allows for symmetric decreased flow from striatum and thalamus. Chronic metabolic dysfunction depletes α KG levels leading to lack of HIF1a degradation and up regulation of VEGF leading to vessel expansion and weakness including mobilization of tight-junction proteins away from blood–brain barrier (3). The combination of vessel impingement, shunting and weakened blood–brain barrier likely results in hemorrhages.

References

    1. Sutherland GR, Auer RN. Primary intracerebral hemorrhage. J Clin Neurosci. 2006;2(5):511–517. doi: 10.1016/j.jocn.2004.12.012. doi: 10.1016/j.jocn.2004.12.012. - DOI - PubMed
    1. Barber PA, Auer RN, Buchan AM, Sutherland GR. Understanding and managing ischemic stroke. Can J Physiol Pharmacol. 2001;2(3):283–296. doi: 10.1139/y00-125. - DOI - PubMed
    1. Schreiber J, Chapman KA, Summar ML, Ah Mew N, Sutton VR, MacLeod E, Stagni K, Ueda K, Franks J, Island E, Matern D, Pena L, Smith B, Urv T, Venditti C, Chakarapani A, Gropman AL. Neurologic considerations in propionic acidemia. Mol Genet Metab. pp. 10–15. doi: 10.1016/j.ymgme.2011.10.003. - PubMed
    1. Strauss KA, Lazovic J, Wintermark M, Morton DH. Multimodal imaging of striatal degeneration in Amish patients with glutaryl-CoA dehydrogenase deficiency. Brain. 2007;2(Pt 7):1905–1920. doi: 10.1093/brain/awm058. - PubMed
    1. Hoffmann GF, Gibson KM, Trefz FK, Nyhan WL, Bremer HJ, Rating D. Neurological manifestations of organic acid disorders. Eur J Pediatr. 1994;2(7 Suppl 1):S94–S100. - PubMed

Publication types

MeSH terms

Supplementary concepts