. 2014 Mar 15;387(2):229-39.
doi: 10.1016/j.ydbio.2014.01.006. Epub 2014 Jan 24.

INO80-dependent regression of ecdysone-induced transcriptional responses regulates developmental timing in Drosophila

Affiliations

INO80-dependent regression of ecdysone-induced transcriptional responses regulates developmental timing in Drosophila

Sarah D Neuman et al. Dev Biol. .

Abstract

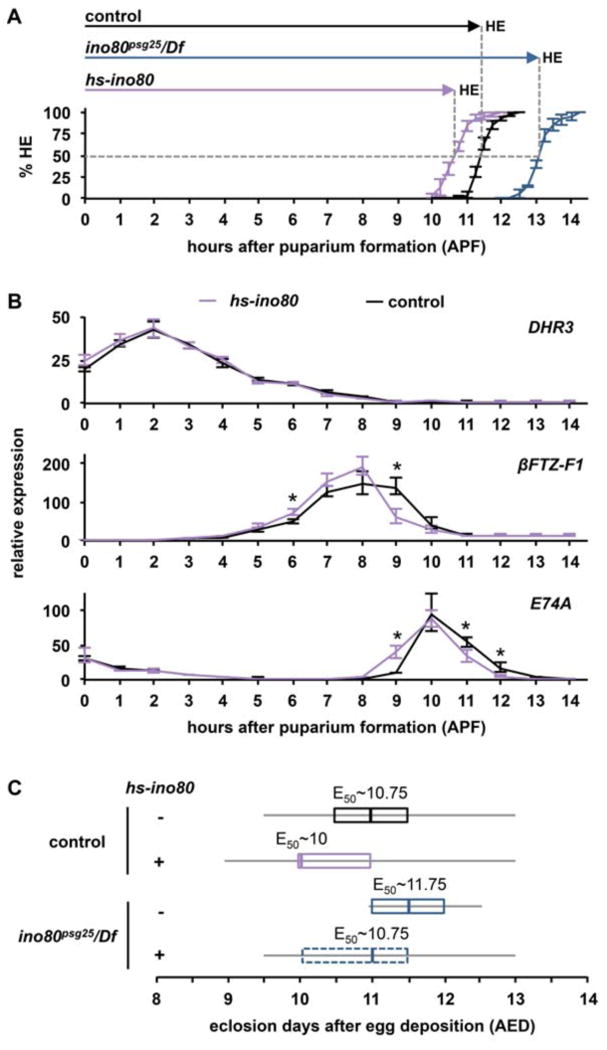
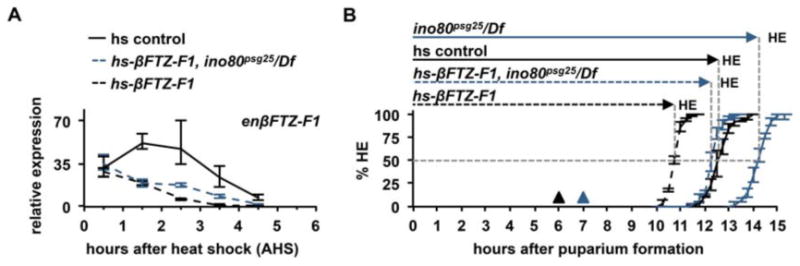
Sequential pulses of the steroid hormone ecdysone regulate the major developmental transitions in Drosophila, and the duration of each developmental stage is determined by the length of time between ecdysone pulses. Ecdysone regulates biological responses by directly initiating target gene transcription. In turn, these transcriptional responses are known to be self-limiting, with mechanisms in place to ensure regression of hormone-dependent transcription. However, the biological significance of these transcriptional repression mechanisms remains unclear. Here we show that the chromatin remodeling protein INO80 facilitates transcriptional repression of ecdysone-regulated genes during prepupal development. In ino80 mutant animals, inefficient repression of transcriptional responses to the late larval ecdysone pulse delays the onset of the subsequent prepupal ecdysone pulse, resulting in a significantly longer prepupal stage. Conversely, increased expression of ino80 is sufficient to shorten the prepupal stage by increasing the rate of transcriptional repression. Furthermore, we demonstrate that enhancing the rate of regression of the mid-prepupal competence factor βFTZ-F1 is sufficient to determine the timing of head eversion and thus the duration of prepupal development. Although ino80 is conserved from yeast to humans, this study represents the first characterization of a bona fide ino80 mutation in any metazoan, raising the possibility that the functions of ino80 in transcriptional repression and developmental timing are evolutionarily conserved.

Keywords: Chromatin remodeler; Developmental timing; Ecdysone; Transcriptional repression.


Figures

Figure 1
Figure 1. Identification of a novel allele of ino80
(A) Schematic describing the psg25 lesion in the ino80 locus. psg25 has a point mutation (G to A) that disrupts the donor splice site after the fourth exon, resulting in retention of an intron fragment and an in-frame stop codon immediately following the mutated donor splice site. Retention of the intron also changes a phenylalanine immediately before the donor splice site to a leucine. Boxes represent exons and shaded regions highlight coding sequences. Diagram to scale, except for two large introns, marked with slashes. Scale bar=300 base pairs (bp). (B) Schematic of the domains of the INO80 protein and the location of the psg25 nonsense mutation, indicated by the dotted line. (C) Leaky expression of ino80 from a hs-ino80 transgene rescues ino80psg25 and ino80ex64(+) or absence (−) of one copy of the hs-ino80 transgene. Presence of the hs-ino80 transgene also rescues the fertility of eclosing animals. Eclosion percentages expressed as observed eclosion percentage divided by expected eclosion percentage (33%).
Figure 2
Figure 2. ino80is required for viability during metamorphosis
(A) qPCR analysis of ino80 mRNA expression throughout development. The highest expression levels are observed at the onset of metamorphosis, from puparium formation to 2 days after puparium formation (APF). Animals staged from egg lay for embryonic (0-6, 6-12 and 12-18 hours after egg lay (AEL)) and larval stages (L1: 30-42 AEL, L2: 54-66 AEL, eL3: 76-88 AEL). wL3 identified by robust expression of Sgs3-GFP. Stages during metamorphosis were synchronized at puparium formation (PF) and collected in 24-hour intervals. y-axis plots relative expression compared to 2 days APF; x-axis denotes the developmental stage analyzed. Three independently-isolated whole animal samples were run for each time point and target genes were normalized to rp49. (B) Lethal phase analysis of homozygous and hemizygous ino80psg25 mutant animals. Most homozygous and hemizygous ino80psg25 mutant animals die after head eversion, as either pupae or pharate adults. A smaller fraction eclose as adults. (C-D) Hemizygous ino80psg25 mutant animals that arrest as pupae (C) or pharate adults (D) have normal morphology, with head eversion and extension of wings and legs. Animals were dissected out of their pupal cases and imaged at their respective terminal stages. PF=puparium formation, PP=prepupa, P=pupa, PA=pharate adult, A=eclosed adult.
Figure 3
Figure 3. Destruction of the larval salivary glands is delayed in ino80psg25 mutant animals
(A) qPCR analysis of target gene expression in control (black lines) and ino80psg25 (blue lines) mutant salivary glands staged relative to head eversion. Control glands have strong induction of rpr and hid by 1.5 h after head eversion (AHE), while ino80psg25 glands do not have maximal induction of rpr and hid until 3 AHE. Induction and regression of E74A and E74B is also delayed in ino80psg25 mutant salivary glands. y-axis represents relative expression compared to the lowest point in control animals; x-axis represents developmental stage relative to head eversion. Three independently-isolated samples were run for each timepoint; relative expression calculated by normalizing to rp49. (B-D) Activation of caspases detected by staining for cleaved-caspase-3 (red) and nuclear lamin (green) in control and ino80psg25 mutant salivary glands. DNA labeled with DAPI shown in blue. Control glands have ubiquitous caspase activation and strong loss of nuclear lamin staining by 1.5 AHE (B). In contrast, ino80psg25 glands have caspase activation similar to controls by 3AHE (D), but not at 1.5 AHE (C). Scale bar is 20μm. AHE= after head eversion.
Figure 4
Figure 4. ino80 is required for efficient regression of ecdysone-regulated genes during prepupal development
(A) qPCR analysis of target genes during prepupal development in control (black lines) and ino80psg25 (blue lines) mutant whole animals. The ecdysone-regulated genes E74A, DHR3, and βFTZ-F1 are induced in the proper sequence in ino80psg25 mutant animals following the late larval ecdysone pulse; however, ino80psg25 mutant animals exhibit significant delays in repression of all three of these genes. In contrast, the ecdysone biosynthetic gene spok, the ecdysone turnover gene Cyp18a1, and the ecdysone concentration-dependent target E74B are unaffected in ino80psg25 mutant animals. y-axis represents relative expression compared to the lowest point in control animals; x-axis represents developmental stage relative to puparium formation. Three independently-isolated whole animal samples were run for each timepoint and normalized to rp49. (B) Experimental paradigm to test efficiency of auto-inhibition by ectopic expression of the βFTZ-F1 and E74A proteins. Control and ino80psg25 animals were heat-shocked two hours prior to the endogenous peak of βFTZ-F1 (dark gray) or E74A (light gray) expression in each respective genotype, then allowed to recover for about 2 hours before isolation of total RNA. Timescale shows hours after puparium formation (APF). Arrows indicate time of heat-shock and isolation. (C) Auto-inhibition of βFTZ-F1 and E74A occurs inefficiently in ino80psg25 mutant animals. On left, expression of βFTZ-F1 protein from the hs-βFTZ-F1 transgene is sufficient to repress endogenous βFTZ-F1 transcription in control animals (white bars). The same treatment in ino80psg25 mutant animals results in incomplete repression of endogenous βFTZ-F1 transcription (blue bar). On right, similar results are obtained in a comparable experiment with ectopic expression of E74A. y-axis represents relative expression compared to the lowest point in each developmental profile; x-axis denotes heat-shock treatment. Asterisks denote significant differences between control and mutant samples (p<0.05).
Figure 5
Figure 5. ino80 regulates the duration of development
(A) Head eversion timing in control (black line), ino80psg25 (blue line), and hs-ino80 (purple line) animals. 50% of control animals head evert by 11.5 APF (HE50∼11.5, total n=156). ino80psg25 mutant animals have delayed head eversion, with 50% of the animals head everting by 13.25 APF (HE50∼13.25, total n=152). hs-ino80 accelerates head eversion, with 50% of animals head everting by 10.75 APF (HE50∼10.75, total n=151). y-axis plots the percentage of animals completing head eversion; x-axis plots time in hours relative to puparium formation (APF). Three independent samples of n∼50 animals were analyzed for each genotype; error bars represent plus or minus one standard deviation. (B) qPCR analysis of ecdysone-regulated transcription in control (black line) and hs-ino80 (purple line) whole animals staged relative to puparium formation. The DHR3 expression profile is nearly identical in control and hs-ino80 animals. In contrast, βFTZ-F1 regresses significantly faster in hs-ino80 animals compared to controls. E74A also displays a significant acceleration in onset and repression in hs-ino80. y-axis plots relative expression compared to the lowest point in controls; x-axis represents stages relative to puparium formation. Three independently-isolated whole animal samples were run for each timepoint and normalized to rp49. Asterisks denote significant differences between control and mutant samples (p<0.05). (C) Box plot of eclosion time in control and ino80psg25 mutant animals with or without the hs-ino80 transgene. Control animals (black box) begin to eclose at 9.5 days AED, and 50% eclose by 10.75 AED (n=624). Few ino80psg25 animals eclose (blue box), but those that do begin to eclose at 11 days AED, and 50% eclose by 11.75 AED (n=19). Increased expression of ino80 from the hs-ino80 transgene (purple box) accelerates eclosion timing, with animals beginning to eclose before 9 days AED (E50∼10 AED, n=906). Leaky expression of ino80 from the hs-ino80 transgene (dotted blue box) is sufficient to rescue the eclosion delay observed in ino80psg25 mutant animals, as hs-ino80/+; ino80psg25/Df animals begin to eclose at 9.5 days AED (E50∼10.75 AED, n=224). For each genotype, the gray horizontal lines (whiskers) represent the range for all animals analyzed, the boxes outline the middle two quartiles, and vertical lines within the boxes denote the median. x-axis represents time to eclosion in days after egg deposition (AED); y-axis shows each respective genotype plus (+) or minus (−) the hs-ino80 transgene. The time when 50% of animals eclose (E50) is listed for each respective genotype.
Figure 6
Figure 6. Precocious transcriptional repression of endogenous βFTZ-F1 is sufficient to accelerate developmental timing
(A) Endogenous βFTZ-F1 regresses significantly faster after expression of βFTZ-F1 protein from a heterologous promoter (hs-βFTZ-F1). All genotypes have similar levels of induction of endogenous βFTZ-F1 at 0.5 hrs after heat shock (AHS). Ectopic βFTZ-F1 protein shuts off endogenous βFTZ-F1 transcription by 3.5 AHS in control animals (dashed black line), but it takes longer in ino80psg25 mutant animals (dashed blue line). y-axis plots relative expression compared the lowest point in the developmental profile; x-axis represents hours after heat-shock (AHS). Three independently-isolated whole animal samples were run for each timepoint and normalized to rp49. (B) Accelerated repression of βFTZ-F1 is sufficient to decrease the duration of prepupal development. 50% of heat-shocked control animals head evert by 12.75 APF (HE50∼12.5 APF, total n=104). However, additional βFTZ-F1 protein accelerates the timing of head eversion by 2 hours (dashed black line, HE50∼10.75 APF, total n=101). 50% of heat-shocked ino80psg25 mutants head evert by 14.25 APF (solid blue line, HE50∼14.25 APF, total n=97), but ectopic expression of βFTZ-F1 protein in the ino80psg25 mutant background accelerates the timing of head eversion by about 2 hours (dashed blue line, HE50∼12.25 APF, total n=99). x-axis represents hours after puparium formation (APF); y-axis represents the percentage of animals head everted. Three independent samples of n∼33 animals were analyzed for each genotype; error bars represent plus or minus one standard deviation. Triangles denote time of heat-shock in each genotype (black=control; blue=ino80psg25/Df).

Similar articles

Cited by

References

    1. Ambros V. Control of developmental timing in Caenorhabditis elegans. Current Opinion in Genetics & Development. 2000;10:428–433. - PubMed
    1. Andres AJ, Thummel CS. Methods for quantitative analysis of transcription in larvae and prepupae. Methods Cell Biol. 1994;44:565–573. - PubMed
    1. Arvidsson S, Kwasniewski M, Riaño-Pachón DM, Mueller-Roeber B. QuantPrime--a flexible tool for reliable high-throughput primer design for quantitative PCR. BMC Bioinformatics. 2008;9:465. - PMC - PubMed
    1. Ashburner M, Chihara C, Meltzer P, Richards G. Temporal control of puffing activity in polytene chromosomes. Cold Spring Harb. Symp Quant Biol. 1974;38:655–662. - PubMed
    1. Bainbridge SP, Bownes M. Staging the metamorphosis of Drosophila melanogaster. Journal of embryology and experimental morphology. 1981;66:57–80. - PubMed

Publication types

MeSH terms