

The use of Bowman's layer vertical topographic thickness map in the diagnosis of keratoconus
- PMID: 24468653
- PMCID: PMC4011960
- DOI: 10.1016/j.ophtha.2013.11.034
The use of Bowman's layer vertical topographic thickness map in the diagnosis of keratoconus
Abstract
Purpose: To evaluate the use of Bowman's layer (BL) vertical topographic thickness maps in diagnosing keratoconus (KC).
Design: Prospective, case control, interventional case series.
Participants: A total of 42 eyes: 22 eyes of 15 normal subjects and 20 eyes of 15 patients with KC.
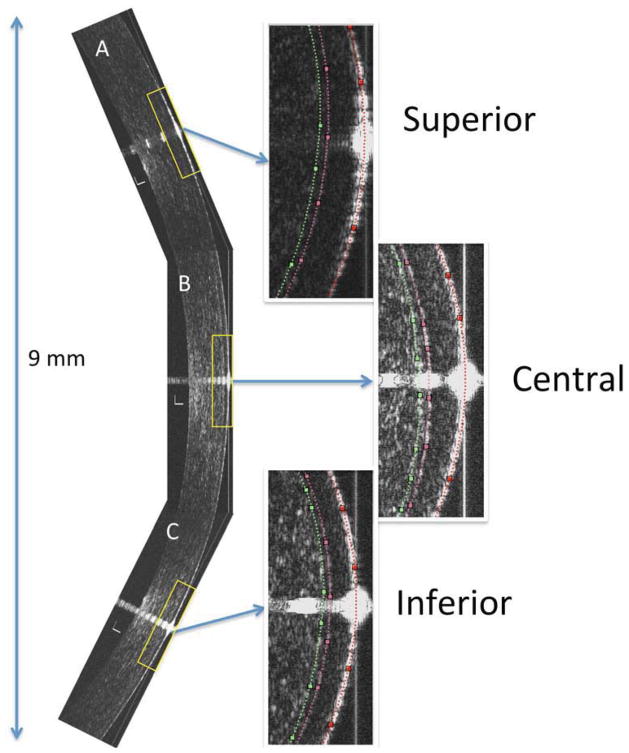
Intervention: Bowman's layer 2-dimensional 9-mm vertical topographic thickness maps were created using custom-made ultra high-resolution optical coherence tomography.
Main outcome measures: Bowman's layer average and minimum thicknesses of the inferior half of the cornea, Bowman's ectasia index (BEI; defined as BL minimum thickness of the inferior half of the cornea divided by BL average thickness of the superior half of the cornea multiplied by 100), BEI-Max (defined as BL minimum thickness of the inferior half of the cornea divided by BL maximum thickness of the superior half of the cornea multiplied by 100), keratometric astigmatism (Ast-K) of patients with KC, and average keratometric (Avg-K) readings.
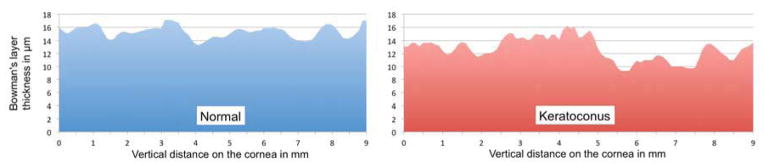
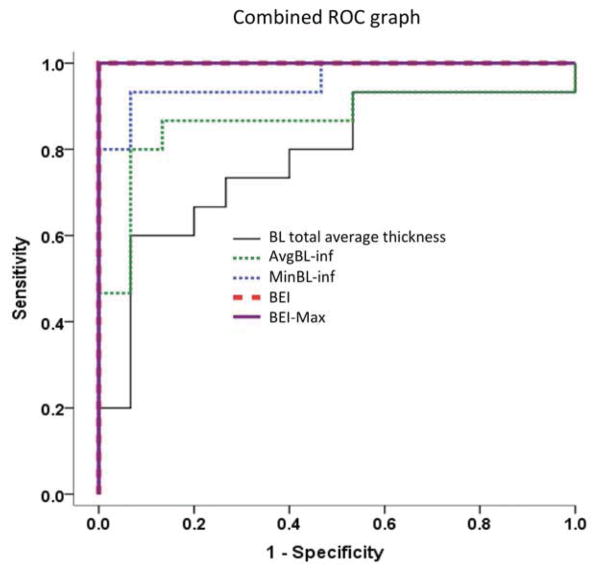
Results: In patients with KC, BL vertical thickness maps disclosed localized relative inferior thinning of the BL. Inferior BL average thickness (normal = 15±2, KC = 12±3 μm), inferior BL minimum thickness (normal = 13±2, KC = 7±3 μm), BEI (normal = 91±7, KC = 48±14), and BEI-Max (normal = 75±8; KC = 40±13) all showed highly significant differences in KC compared with normal subjects (P< 0.001). Receiver operating characteristic (ROC) curve analysis showed excellent predictive accuracy for BEI and BEI-Max with 100% sensitivity and specificity (area under the curve [AUC] of 1) with cutoff values of 80 and 60, respectively. The AUC of inferior BL average thickness and minimum thickness were 0.87 and 0.96 with a sensitivity of 80% and 93%, respectively, and a specificity of 93% and 93%, respectively. Inferior BL average thickness, inferior BL minimum thickness, BEI, and BEI-Max correlated highly to Ast-K (R = -0.72, -0.82, -0.84, and -0.82, respectively; P< 0.001) and to Avg-K (R = -0.62, P< 0.001; R = -0.59, P = 0.001; R = -0.60, P< 0.001; and R = -0.59, P = 0.001, respectively).
Conclusions: Bowman's layer vertical topographic thickness maps of patients with KC disclose characteristic localized relative inferior thinning. Inferior BL average thickness, inferior BL minimum thickness, BEI, and BEI-Max are qualitative and quantitative indices for the diagnosis of KC that accurately correlate with the severity of KC. In our pilot study, BEI and BEI-Max showed excellent accuracy, sensitivity, and specificity in the diagnosis of KC.
Copyright © 2014 American Academy of Ophthalmology. Published by Elsevier Inc. All rights reserved.
Conflict of interest statement
Figures
References
-
- Krachmer JH, Feder RS, Belin MW. Keratoconus and related noninflammatory corneal thinning disorders. Surv Ophthalmol. 1984;28:293–322. - PubMed
-
- Komai Y, Ushiki T. The three-dimensional organization of collagen fibrils in the human cornea and sclera. Invest Ophthalmol Vis Sci. 1991;32:2244–58. - PubMed
-
- Sykakis E, Carley F, Irion L, et al. An in depth analysis of histopathological characteristics found in keratoconus. Pathology. 2012;44:234–9. - PubMed
-
- Sawaguchi S, Fukuchi T, Abe H, et al. Three-dimensional scanning electron microscopic study of keratoconus corneas. Arch Ophthalmol. 1998;116:62–8. - PubMed
-
- Sawaguchi S, Fukuchi T, Shirakashi M, et al. Three dimensional architecture of Bowman’s collagen fibrils in diseased corneas: a scanning electron microscopic study [in Japanese] Nihon Ganka Kiyo. 1995;46:1261–5.
Publication types
MeSH terms
Grants and funding
LinkOut - more resources
Full Text Sources
Other Literature Sources
