. 2014 Jan 28:4:3912.
doi: 10.1038/srep03912.

A rapid and massive gene expression shift marking adolescent transition in C. elegans

Affiliations

A rapid and massive gene expression shift marking adolescent transition in C. elegans

L Basten Snoek et al. Sci Rep. .

Abstract

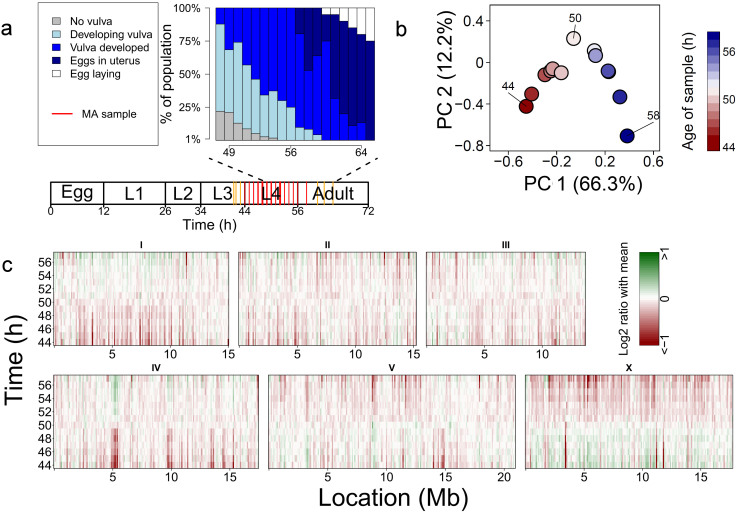
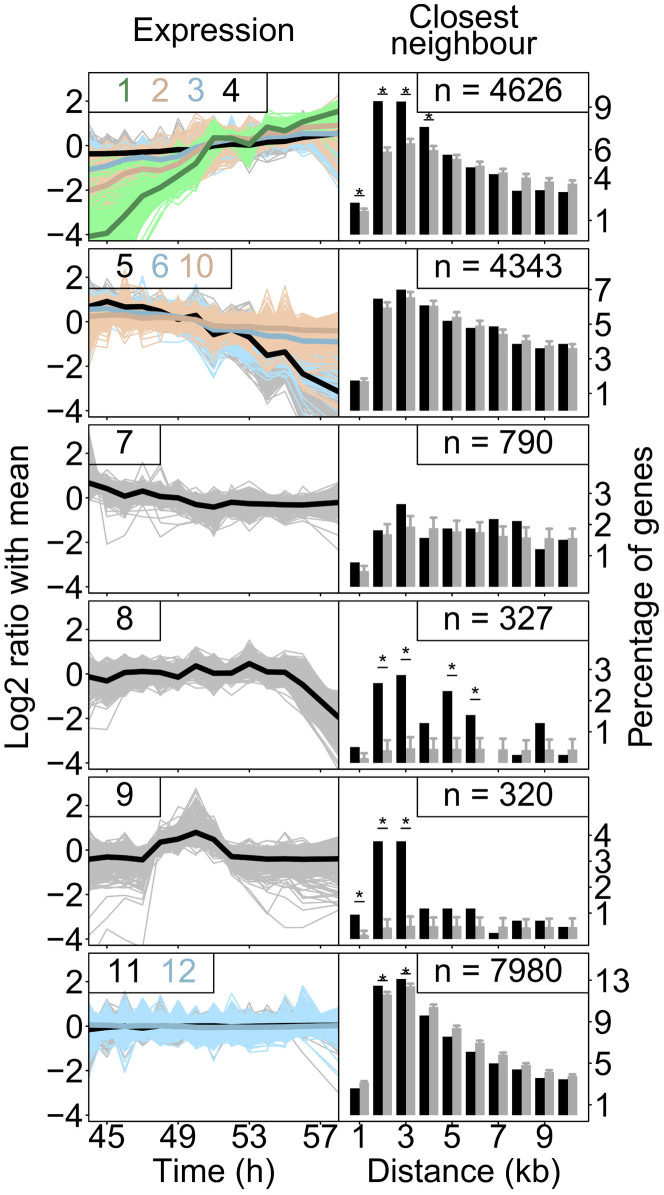
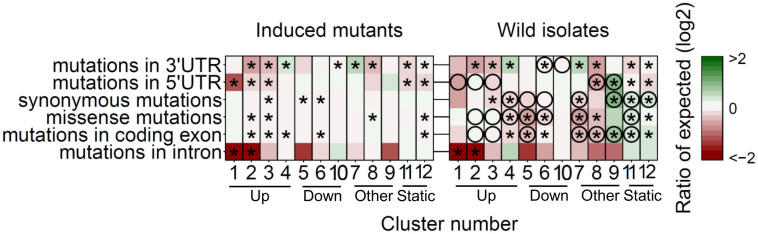
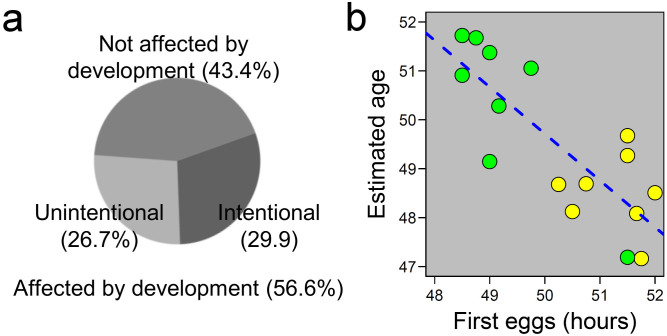
Organismal development is the most dynamic period of the life cycle, yet we have only a rough understanding of the dynamics of gene expression during adolescent transition. Here we show that adolescence in Caenorhabditis elegans is characterized by a spectacular expression shift of conserved and highly polymorphic genes. Using a high resolution time series we found that in adolescent worms over 10,000 genes changed their expression. These genes were clustered according to their expression patterns. One cluster involved in chromatin remodelling showed a brief up-regulation around 50 h post-hatch. At the same time a spectacular shift in expression was observed. Sequence comparisons for this cluster across many genotypes revealed diversifying selection. Strongly up-regulated genes showed signs of purifying selection in non-coding regions, indicating that adolescence-active genes are constrained on their regulatory properties. Our findings improve our understanding of adolescent transition and help to eliminate experimental artefacts due to incorrect developmental timing.


Figures

Figure 1
Figure 1. Experimental setup and an overview of the expression changes.
(a) Sampling setup. At 20°C, eggs hatch 10–12 hours after they were laid, leading to L1 stage worms. First, 2nd, 3rd and 4th molts occur 26, 34, 44 and 56 hours after egg laying resp., leading to L2, L3, L4 and adult worms. Microscopic observations of the developmental stage of the vulva at several time points are summarized in the blue graph. The red lines in the diagram below the graph represent the time points at which samples for the microarrays (MA) were drawn. The yellow lines show sampling points that were used later to confirm that the MA data could be used to predict the age of a sample (see Supplementary methods for more information). (b) A Principal component analysis of the relative gene expression shows that 66.3% of the variation sorts the time-points in a chronological order. Notably, the 50 h time-point is very distant from the others, indicating the sudden switch in expression. (c) The relative expression in log2 ratio of the mean, shown in 100 kb bins. There is a pronounced shift in the expression activity of the chromosomal regions, centring around 50 hrs.
Figure 2
Figure 2. The temporal expression as identified by k-means clustering.
The 12 clusters (also see Supplementary fig. S3 and table S1) are shown, grouped by the direction of the gene expression changes. The six distinct expression changes found are: up-regulation (clusters 1, 2, 3 and 4), down-regulation (clusters 5, 6 and 10), down-regulation in early L4 (cluster 7), down regulation in late L4 (cluster 8), no change (cluster 11 and 12) and up-regulation mid-L4 (cluster 9). In the line-graphs on the left the expression (log2 ratio of the mean) of all the genes in a cluster (light colours) and the average expression of all these genes (dark colours) are shown over time (in hours). The numbers of the clusters depicted are shown in the graph. For example: the expression patterns of all genes falling in category 6 are shown in light-blue and their average is shown in blue. The bar-charts show the proximity of genes within the same group as a percentage of genes having their neighbour at a particular distance (black). The grey bars show what to expect based on a random set of genes with the same size. The error-bars indicate the standard deviation found over 1,000 random sets. The asterisks indicate significant increases of genes found at a specific distance (FDR < 0.01). Four out of these six categories consist of genes that are physically closer together than expected based on equally sized random sets.
Figure 3
Figure 3. Mutation frequencies coupled to the expression profile clusters.
Mutation frequencies are shown as the log2 ratio versus expected (based on random group of genes of the same size) and an asterisk indicates significant in- and decreases (FDR < 0.01). Circles in right heat-map indicate differences between frequencies found in the induced mutants and the wild isolates. The clusters are ordered based on their expression pattern.
Figure 4
Figure 4. Consequences for previous and future studies.
(a) The transcriptomic ruler was applied to all studies deposited in the SPELL database, which showed that >50% of the studies has a developmental component, which is unintentional in 26% of all cases. (b) In a follow-up experiment the influence of food-source (Escherichia coli in yellow and Erwinia rhapontici in green) was shown to have a small but significant impact on the speed of development, C. elegans develops faster on E. rhapontici (R2 = 0.63, p < 0.001; also see Supplementary discussion).

References

    1. Gutteling E. W., Riksen J. A., Bakker J. & Kammenga J. E. Mapping phenotypic plasticity and genotype-environment interactions affecting life-history traits in Caenorhabditis elegans. Heredity 98, 28–37, 10.1038/sj.hdy.6800894 (2007). - PubMed
    1. Viñuela A., Snoek L. B., Riksen J. A. & Kammenga J. E. Genome-wide gene expression regulation as a function of genotype and age in C. elegans. Genome research 20, 929–937, 10.1101/gr.102160.109 (2010). - PMC - PubMed
    1. Viñuela A., Snoek L. B., Riksen J. A. & Kammenga J. E. Aging Uncouples Heritability and Expression-QTL in Caenorhabditis elegans. G3 2, 597–605, 10.1534/g3.112.002212 (2012). - PMC - PubMed
    1. Francesconi M. & Lehner B. The effects of genetic variation on gene expression dynamics during development. Nature, 10.1038/nature12772 (2013). - PubMed
    1. Doroszuk A., Snoek L. B., Fradin E., Riksen J. & Kammenga J. A genome-wide library of CB4856/N2 introgression lines of Caenorhabditis elegans. Nucleic Acids Res 37, e110, 10.1093/nar/gkp528 (2009). - PMC - PubMed

Publication types

Substances