. 2015 Jan 29;34(5):589-99.
doi: 10.1038/onc.2013.589. Epub 2014 Jan 27.

p53 suppresses carcinoma progression by inhibiting mTOR pathway activation

Affiliations

p53 suppresses carcinoma progression by inhibiting mTOR pathway activation

N Akeno et al. Oncogene. .

Abstract

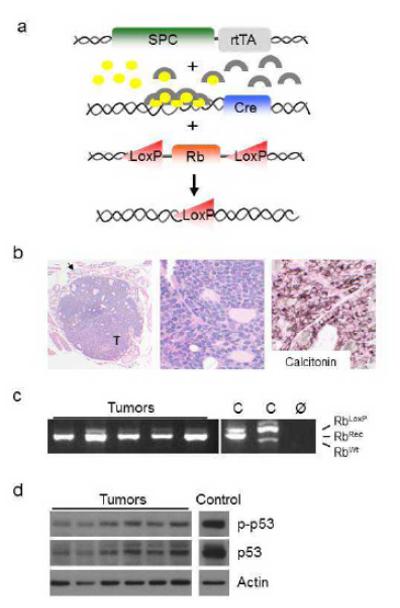
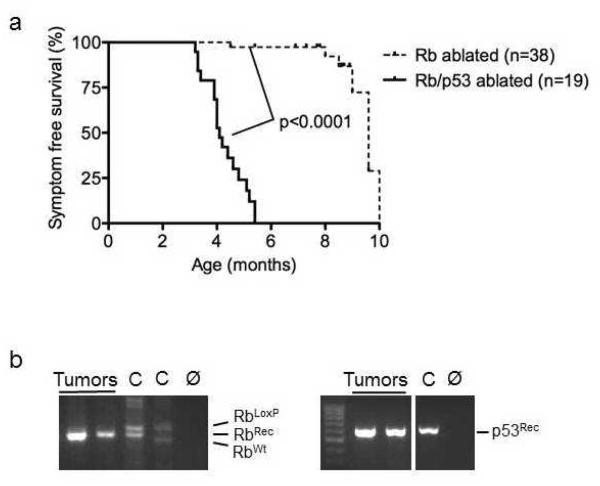
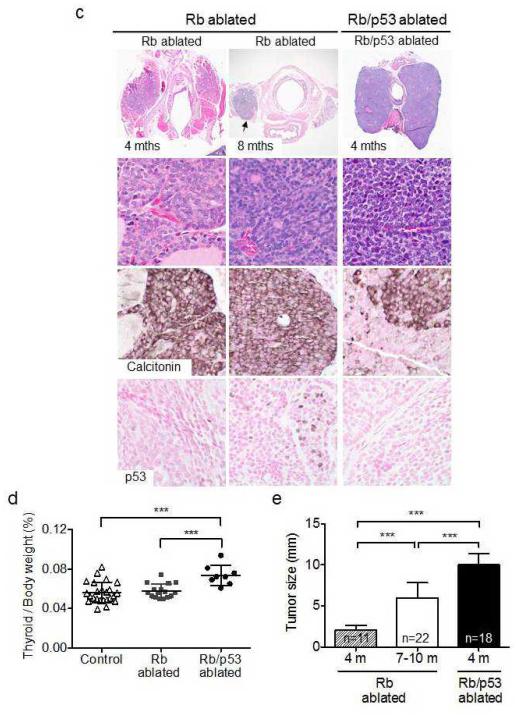
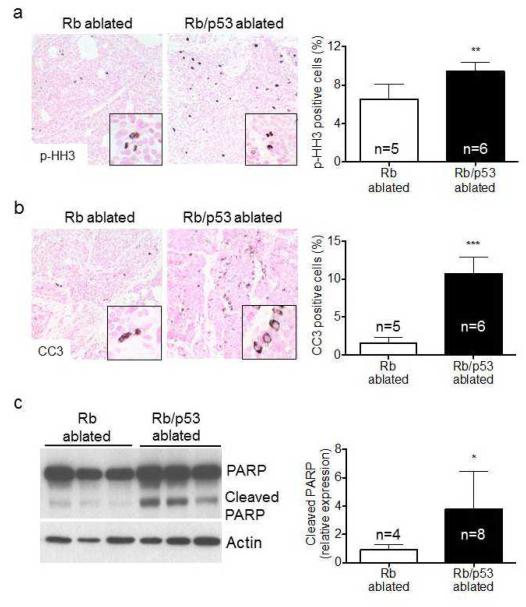
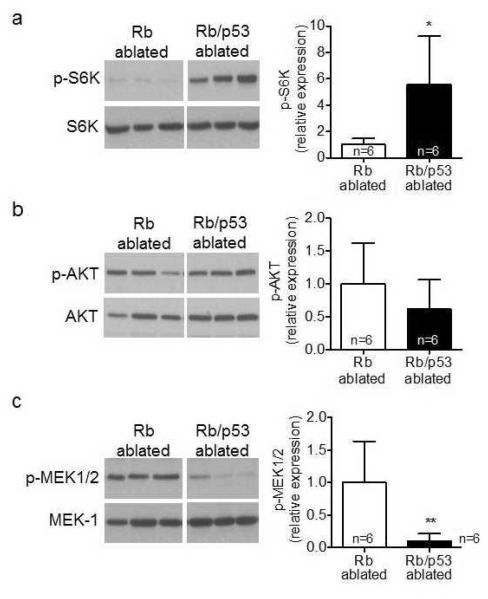
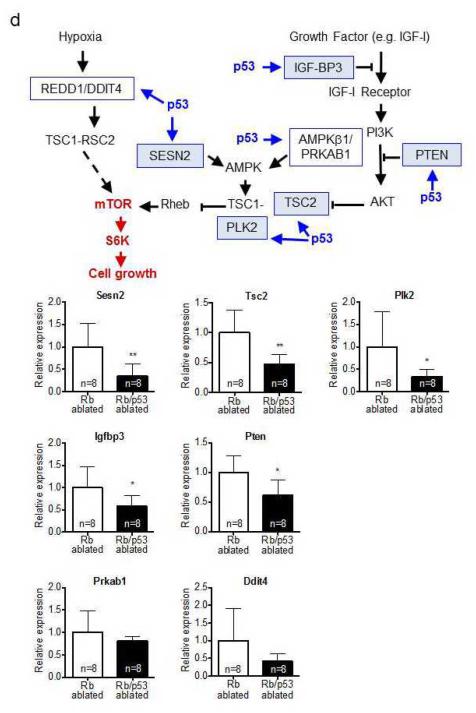
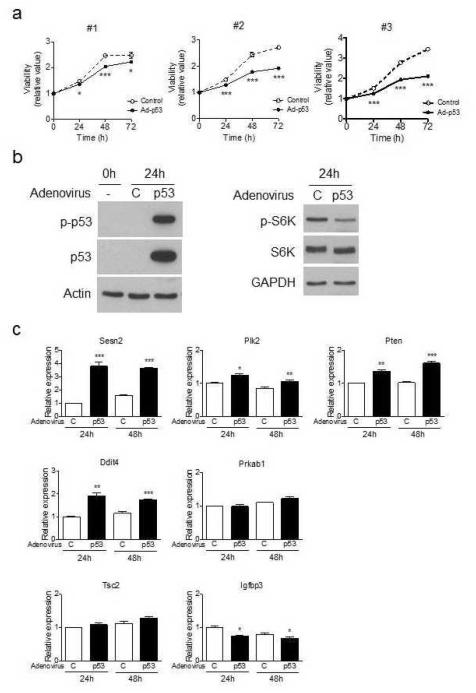
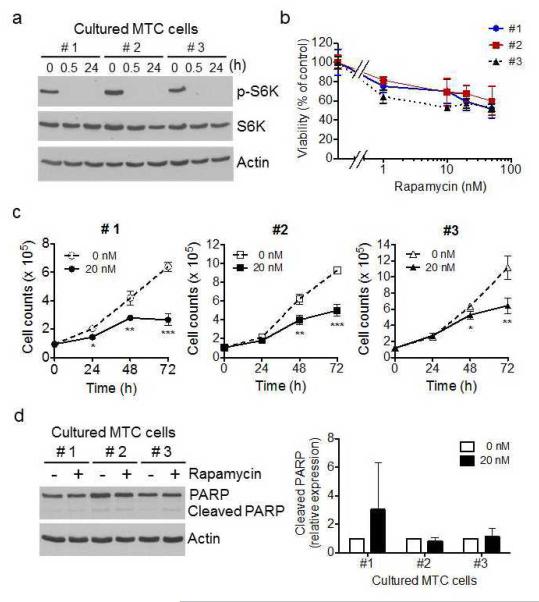
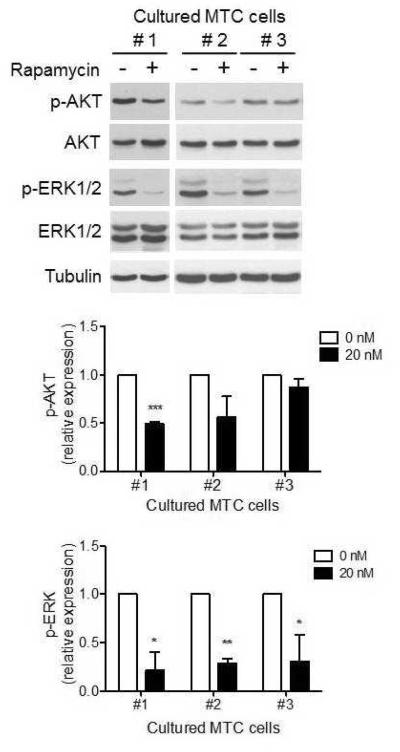
Genetic alterations in human cancers and murine models indicate that retinoblastoma (Rb) and p53 have critical tumor suppressive functions in retinoblastoma, a tumor of neural origin, and neuroendocrine tumors including small cell lung cancer and medullary thyroid cancer (MTC). Rb inactivation is the initiating lesion in retinoblastoma and current models propose that induction of apoptosis is a key p53 tumor suppressive function. Genetic studies in mice, however, indicate that other undefined p53 tumor suppressive functions are operative in vivo. How p53 loss cooperates with Rb inactivation to promote carcinogenesis is also not fully understood. In the current study, genetically engineered mice were generated to determine the role of Rb and p53 in MTC pathogenesis and test the hypothesis that p53 suppresses carcinogenesis by inhibiting mammalian target of rapamycin (mTOR) signaling. Conditional Rb ablation resulted in thyroid tumors mimicking human MTC, and additional p53 loss led to rapid tumor progression. p53 suppressed tumorigenesis by inhibiting cell cycle progression, but did not induce apoptosis. On the contrary, p53 loss led to increased apoptosis that had to be overcome for tumor progression. The mTOR activity was markedly increased in p53-deficient tumors and rapamycin treatment suppressed tumor cell growth, identifying mTOR inhibition as a critical p53 tumor suppressive function. Rapamycin treatment did not result in AKT/mitogen-activated protein kinase activation, providing evidence that this feedback mechanism operative in other cancers is not a general response to mTORC1 inhibition. Together, these studies provide mechanistic links between genetic alterations and aberrant signaling pathways critical in carcinogenesis, and identify essential Rb and p53 tumor suppressive functions in vivo.


Figures

Figure 1
Figure 1. Conditional Rb ablation in the thyroid results in medullary thyroid carcinoma (MTC)
(a) Rb ablation was targeted to the lung and a subset of thyroid cells by generating mice containing 1) the reverse tetracycline transactivator (rtTA) under control of the human surfactant protein C (SPC) promoter, 2) Cre recombinase under control of the tet operator and minimal CMV promoter, and 3) floxed (LoxP) Rb alleles. Doxycycline treatment (circles) activates rtTA (arches) which induces Cre recombinase expression resulting in floxed Rb gene recombination. (b) Mice with conditional Rb ablation developed thyroid tumors (T) that mimic human MTC by morphology (H&E staining) and calcitonin expression as assessed by immunohistochemistry. An arrow indicates normal thyroid tissue surrounding the tumor. Representative images from 8-9 month old Rb ablated mice. (c) Rb recombination (RbRec) was detected in MTC derived DNA by PCR analysis. Floxed (RbLoxP), RbRec and wild type Rb (RbWt) bands are indicated. C and Ø represent positive and negative no DNA controls, respectively. (d) Activated, phosphorylated p53 and total p53 protein were detected in Rb ablated tumors by Western blot analysis. Blots were reprobed for actin as a loading control.
Figure 2
Figure 2. p53 loss promotes Rb deficient MTC progression
(a) p53 loss was associated with a marked reduction in symptom free survival of Rb ablated mice as indicated by curves showing the percentage of Rb ablated and Rb/p53 ablated mice that had MTC at the time of death, when moribund, or after losing ≥ 10% body weight. Median survival for Rb and Rb/p53 ablated mice was 9.6 and 4.1 months, respectively. (b) Rb (RbRec) and p53 (p53Rec) recombination was detected in MTC derived DNA by PCR analysis. RbLoxP, RbRec. RbWt and p53Rec bands are indicated. C and Ø represent positive and negative no DNA controls, respectively. (c) Mice with combined Rb/p53 ablated thyroids developed tumors similar to that seen after Rb ablation alone. The thyroid tumors mimicked human MTC by morphology (H&E stained low and high power images are shown) and calcitonin expression as assessed by immunohistochemistry. p53 was detected by immunohistochemistry in all Rb ablated tumors tested (n=3 and 16 at 4 and 7-9 months, respectively) with variable numbers of p53 positive cells in individual tumors. No p53 was detected in Rb/p53 ablated tumors (n=5). Arrows indicate tumors. (d) Thyroid to body weight ratios in 9 week old mice were significantly increased after combined Rb/p53 ablation as compared to Rb ablation alone and Rb/p53 proficient controls. (e) Rb/p53 ablated tumors were significantly larger than Rb ablated tumors in mice at 4 months and 7-10 months of age. Data are represented as mean ± SD. ***p<0.001.
Figure 3
Figure 3. p53 loss stimulates MTC cell proliferation and apoptosis
(a) Cell proliferation was determined by percentage of tumor cells positive for the mitotic marker, phosphorylated histone H3 (p-HH3) by immunohistochemistry. The percentage of p-HH3 positive cells was significantly increased in Rb/p53 as compared to Rb ablated tumors. Apoptotic cell death was assessed by immunohistchemistry for cleaved caspase-3 (CC3) (b) and Western blot analysis for cleaved PARP (c). Both CC3 positive cells and cleaved PARP were significantly increased in Rb/p53 compared to Rb ablated tumors. Western blots were reprobed for actin as a loading control. Quantification of cleaved PARP is represented as relative densitometric values of cleaved PARP normalized to actin. Data are represented as mean ± SD. *p<0.05, **p<0.01 and ***p<0.001.
Figure 4
Figure 4. p53 loss results in mTOR pathway activation in Rb deficient MTC
Activated, phosphorylated forms of S6 kinase (p-S6K), AKT (p-AKT) and MEK (p-MEK1/2) as well as corresponding total protein levels (S6K, AKT and MEK-1) were compared between Rb and Rb/p53 ablated thyroid tumors by Western blot analysis. (a) p-S6K was significantly increased in Rb/p53 as compared to Rb ablated tumors despite similar total S6K levels. (b) p-AKT and total AKT levels were similar in Rb and Rb/p53 ablated tumors. (c) p-MEK was significantly decreased in Rb/p53 as compared to Rb ablated tumors despite similar total MEK levels. Quantification is represented as relative densitometric values of phosphorylated:total protein ratios. (d) p53 loss in Rb deficient MTC results in decreased expression of mTOR pathway inhibitors. Schematic diagram illustrating previously identified p53 target genes (blue outlined boxes) known to repress mTOR signaling. Activation is indicated in blue and suppression in red. Quantitative RT-PCR showed significantly reduced expression of Sesn2, Tsc2, Plk2, Igfbp3 and Pten (blue shaded boxes), but not Ddit4 and Prkab1 (unshaded boxes), in Rb/p53 as compared to Rb ablated MTC. Data are represented as mean ± SD. *p<0.05, **p<0.01.
Figure 5
Figure 5
p53 expression inhibits cell growth and decreases mTOR pathway activity in Rb/p53 deficient MTC cells (a) Cell growth was significantly decreased by 24 hours and sustained to 72 hours after infection with p53 adenovirus (Ad-p53) as compared to control virus in three independently derived MTC cell cultures (#1, #2, #3) derived from three different mice as assessed by WST-1 assays. Results are representative of two independent experiments. Data are represented as mean ± SD (n=4 wells/group). (b) Expression of activated p53 phosphorylated at serine 15 (p-p53) and total p53 (p53) protein was associated with decreased p-S6K protein levels as compared to cells infected with control adenovirus (C) 24 hours after infection of cell culture #2. No change was detected in total S6K levels. Blots were reprobed for actin or GAPDH as loading controls. Results are representative of two independent experiments. (c) p53 expression in Rb/p53 deficient MTC cells resulted in increased expression of mTOR pathway inhibitors. Quantitative RT-PCR showed significantly increased expression of Sesn2, Plk2, Pten and Ddit4, no change in Tsc2 and Prkab1 expression, and decreased expression of Igfbp3 in p53 expressing MTC culture #2 cells as compared to cells infected with control virus (C). Data are represented as mean ± SD (n=3 wells/group). *p<0.05, **p<0.01 and ***p<0.001.
Figure 6
Figure 6. mTOR pathway inhibition by rapamycin suppresses Rb/p53 deficient MTC cell growth
The effect of rapamycin on Rb/p53 deficient MTC cell growth was assessed in three independently derived MTC cell cultures (#1, #2 and #3) generated from three different mice. (a) Western blot analysis for S6K phosphorylation demonstrated dramatic mTOR signaling inhibition by 0.5 hours (h) after 20 nM rapamycin treatment that was sustained at 24 hours in all three cell cultures. Total S6K levels were similar at all time points. Blots were reprobed for actin as a loading control. Results are representative of three independent experiments. (b) MTC cell cultures were inhibited by rapamycin in a dose dependent manner as assessed by WST-1 assays performed after 72 hours of rapamycin treatment. Results are representative of three independent experiments. Data are represented as mean ± SD (n=6 wells/group). (c) MTC cell growth was significantly decreased by 48 hours after treatment with 20 nM rapamycin (20 nM) as compared to vehicle controls (0 nM) in all three cell cultures as assessed by cell counts in time-course experiments. Results are representative of two independent experiments. Data are represented as mean ± SD (n=3 wells/group). (d) Cleaved PARP levels were similar in cultured MTC cells treated for 24 hours with 20 nM rapamycin and vehicle controls by Western blot analysis. Results are representative of three independent experiments. Quantification of cleaved PARP is represented as relative densitometric values of cleaved PARP normalized to actin. Data are represented as mean ± SD. *p<0.05, **p<0.01 and ***p<0.001.
Figure 7
Figure 7. Rapamycin inhibition of mTOR signaling in Rb/p53 deficient MTC cells does not lead to MAPK or AKT pathway activation
p-AKT was decreased or unchanged in three independently derived MTC cell cultures treated with 20 nM rapamycin (20 nM) for 24 hours compared to vehicle controls (0 nM) as assessed by Western blot analysis. p-ERK1/2 levels were significantly decreased in all three cell cultures. Total AKT (AKT) and ERK (ERK1/2) levels were similar in rapamycin treated and controls. Western blots were reprobed with tubulin as a loading control. Quantification is represented as relative densitometric values of phosphorylated:total protein ratios. Results are representative of three independent experiments. Data are represented as mean ± SD. *p<0.05, **p<0.01 and ***p<0.001.

References

    1. Levine AJ, Oren M. The first 30 years of p53: growing ever more complex. Nature reviews Cancer. 2009;9(10):749–58. Epub 2009/09/25. - PMC - PubMed
    1. Stiewe T. The p53 family in differentiation and tumorigenesis. Nature reviews Cancer. 2007;7(3):165–8. Epub 2007/03/03. - PubMed
    1. Vousden KH, Prives C. Blinded by the Light: The Growing Complexity of p53. Cell. 2009;137(3):413–31. Epub 2009/05/05. - PubMed
    1. Liu G, Parant JM, Lang G, Chau P, Chavez-Reyes A, El-Naggar AK, et al. Chromosome stability, in the absence of apoptosis, is critical for suppression of tumorigenesis in Trp53 mutant mice. Nature genetics. 2004;36(1):63–8. Epub 2004/01/01. - PubMed
    1. Feng Z, Levine AJ. The regulation of energy metabolism and the IGF-1/mTOR pathways by the p53 protein. Trends in cell biology. 2010;20(7):427–34. Epub 2010/04/20. - PMC - PubMed

Publication types

MeSH terms

Supplementary concepts