Sarcoplasmic reticulum Ca2+ uptake and leak properties, and SERCA isoform expression, in type I and type II fibres of human skeletal muscle
- PMID: 24469076
- PMCID: PMC3961094
- DOI: 10.1113/jphysiol.2013.269373
Sarcoplasmic reticulum Ca2+ uptake and leak properties, and SERCA isoform expression, in type I and type II fibres of human skeletal muscle
Abstract
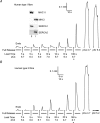
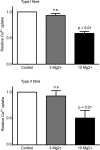
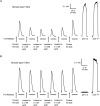
The Ca(2+) uptake properties of the sarcoplasmic reticulum (SR) were compared between type I and type II fibres of vastus lateralis muscle of young healthy adults. Individual mechanically skinned muscle fibres were exposed to solutions with the free [Ca(2+)] heavily buffered in the pCa range (-log10[Ca(2+)]) 7.3-6.0 for set times and the amount of net SR Ca(2+) accumulation determined from the force response elicited upon emptying the SR of all Ca(2+). Western blotting was used to determine fibre type and the sarco(endo)plasmic reticulum Ca(2+)-ATPase (SERCA) isoform present in every fibre examined. Type I fibres contained only SERCA2 and displayed half-maximal Ca(2+) uptake rate at ∼pCa 6.8, whereas type II fibres contained only SERCA1 and displayed half-maximal Ca(2+) uptake rate at ∼pCa 6.6. Maximal Ca(2+) uptake rate was ∼0.18 and ∼0.21 mmol Ca(2+) (l fibre)(-1) s(-1) in type I and type II fibres, respectively, in good accord with previously measured SR ATPase activity. Increasing free [Mg(2+)] from 1 to 3 mM had no significant effect on the net Ca(2+) uptake rate at pCa 6.0, indicating that there was little or no calcium-induced calcium release occurring through the Ca(2+) release channels during uptake in either fibre type. Ca(2+) leakage from the SR at pCa 8.5, which is thought to occur at least in part through the SERCA, was ∼2-fold lower in type II fibres than in type I fibres, and was little affected by the presence of ADP, in marked contrast to the larger SR Ca(2+) leak observed in rat muscle fibres under the same conditions. The higher affinity of Ca(2+) uptake in the type I human fibres can account for the higher relative level of SR Ca(2+) loading observed in type I compared to type II fibres, and the SR Ca(2+) leakage characteristics of the human fibres suggest that the SERCAs are regulated differently from those in rat and contribute comparatively less to resting metabolic rate.
Figures


Comment in
-
Calcium handling in muscle fibres of mice and men: evolutionary adaptation in different species to optimize performance and save energy.J Physiol. 2014 Mar 15;592(6):1173-4. doi: 10.1113/jphysiol.2014.272344. J Physiol. 2014. PMID: 24634016 Free PMC article. No abstract available.
Similar articles
-
Calsequestrin content and SERCA determine normal and maximal Ca2+ storage levels in sarcoplasmic reticulum of fast- and slow-twitch fibres of rat.J Physiol. 2009 Jan 15;587(2):443-60. doi: 10.1113/jphysiol.2008.163162. Epub 2008 Nov 24. J Physiol. 2009. PMID: 19029185 Free PMC article.
-
Endogenous and maximal sarcoplasmic reticulum calcium content and calsequestrin expression in type I and type II human skeletal muscle fibres.J Physiol. 2013 Dec 1;591(23):6053-68. doi: 10.1113/jphysiol.2013.265900. Epub 2013 Oct 14. J Physiol. 2013. PMID: 24127619 Free PMC article.
-
ATP consumption by sarcoplasmic reticulum Ca²⁺ pumps accounts for 40-50% of resting metabolic rate in mouse fast and slow twitch skeletal muscle.PLoS One. 2013 Jul 1;8(7):e68924. doi: 10.1371/journal.pone.0068924. Print 2013. PLoS One. 2013. PMID: 23840903 Free PMC article.
-
Sarco-Endoplasmic Reticulum Calcium Release Model Based on Changes in the Luminal Calcium Content.Adv Exp Med Biol. 2020;1131:337-370. doi: 10.1007/978-3-030-12457-1_14. Adv Exp Med Biol. 2020. PMID: 31646517 Review.
-
Ca2+ stores regulate ryanodine receptor Ca2+ release channels via luminal and cytosolic Ca2+ sites.Clin Exp Pharmacol Physiol. 2007 Sep;34(9):889-96. doi: 10.1111/j.1440-1681.2007.04708.x. Clin Exp Pharmacol Physiol. 2007. PMID: 17645636 Review.
Cited by
-
Contractile properties and sarcoplasmic reticulum calcium content in type I and type II skeletal muscle fibres in active aged humans.J Physiol. 2015 Jun 1;593(11):2499-514. doi: 10.1113/JP270179. Epub 2015 Apr 17. J Physiol. 2015. PMID: 25809942 Free PMC article.
-
Caffeine as a tool to investigate sarcoplasmic reticulum and intracellular calcium dynamics in human skeletal muscles.J Muscle Res Cell Motil. 2021 Jun;42(2):281-289. doi: 10.1007/s10974-020-09574-7. Epub 2020 Feb 7. J Muscle Res Cell Motil. 2021. PMID: 32034582 Review.
-
DNA methylation assessment from human slow- and fast-twitch skeletal muscle fibers.J Appl Physiol (1985). 2017 Apr 1;122(4):952-967. doi: 10.1152/japplphysiol.00867.2016. Epub 2017 Jan 5. J Appl Physiol (1985). 2017. PMID: 28057818 Free PMC article.
-
The relationship between form and function throughout the history of excitation-contraction coupling.J Gen Physiol. 2018 Feb 5;150(2):189-210. doi: 10.1085/jgp.201711889. Epub 2018 Jan 9. J Gen Physiol. 2018. PMID: 29317466 Free PMC article. Review.
-
The influence of sex on the effects of inorganic nitrate supplementation on muscular power and endurance.J Appl Physiol (1985). 2024 Dec 1;137(6):1649-1658. doi: 10.1152/japplphysiol.00321.2024. Epub 2024 Oct 17. J Appl Physiol (1985). 2024. PMID: 39417813 Clinical Trial.
References
-
- Beard NA, Laver DR, Dulhunty AF. Calsequestrin and the calcium release channel of skeletal and cardiac muscle. Prog Biophys Mol Biol. 2004;85:33–69. - PubMed
Publication types
MeSH terms
Substances
LinkOut - more resources
Full Text Sources
Other Literature Sources
Research Materials
Miscellaneous

