Review
. 2014 Jan 24;15(2):1767-803.
doi: 10.3390/ijms15021767.

Atomistic Monte Carlo simulation of lipid membranes

Affiliations
Review

Atomistic Monte Carlo simulation of lipid membranes

Daniel Wüstner et al. Int J Mol Sci. .

Abstract

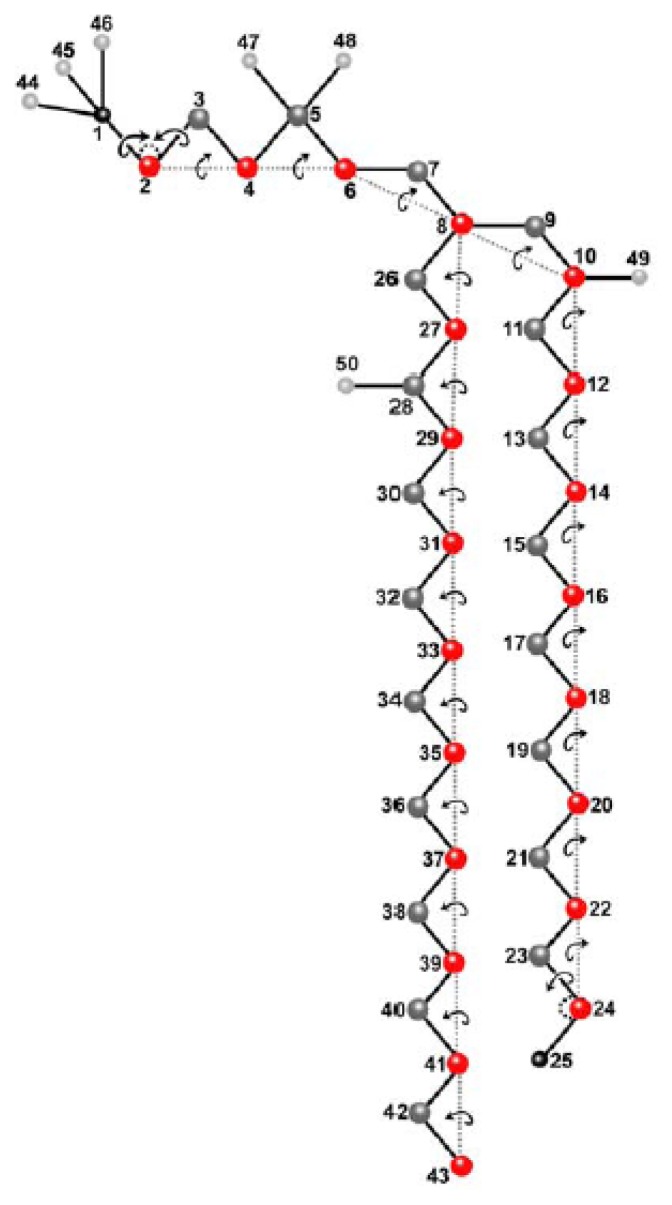
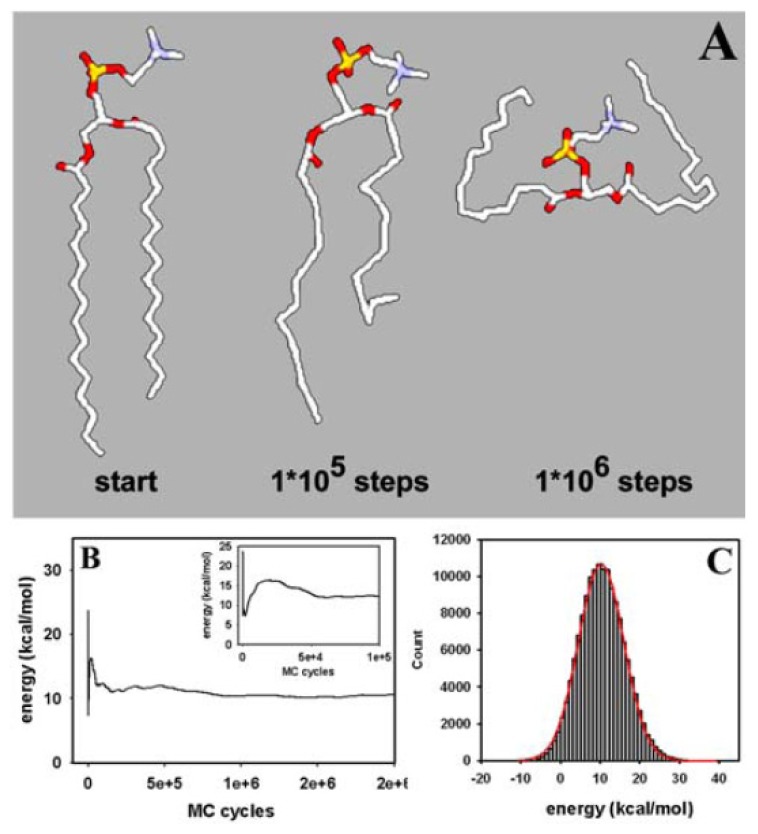
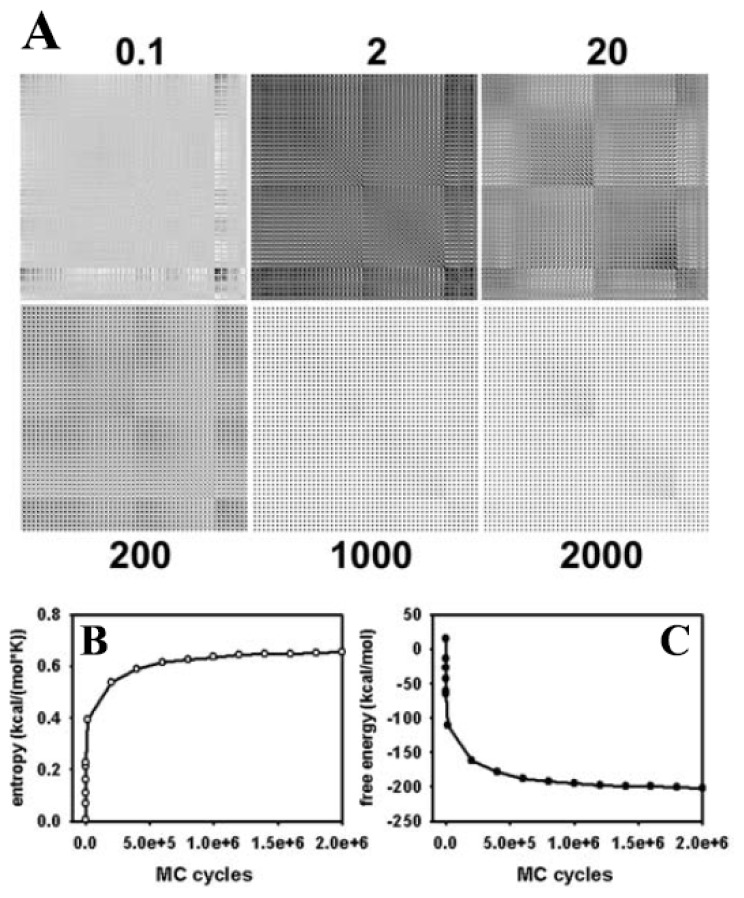
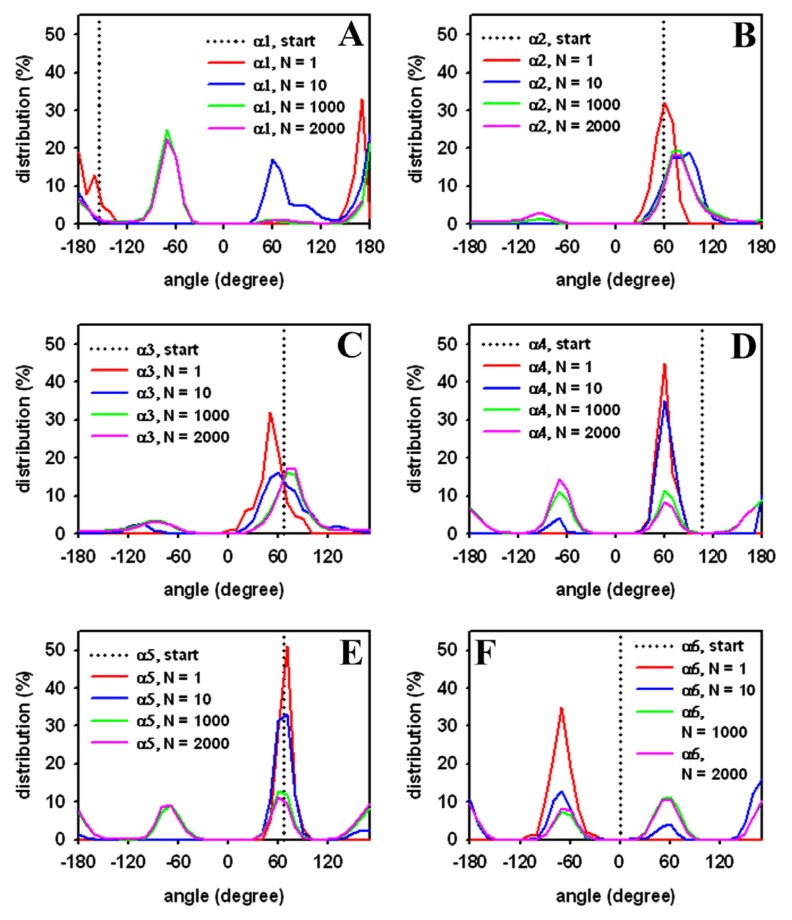
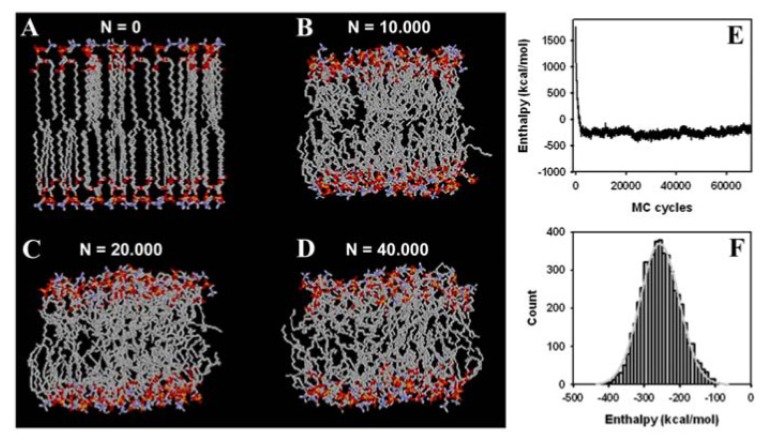
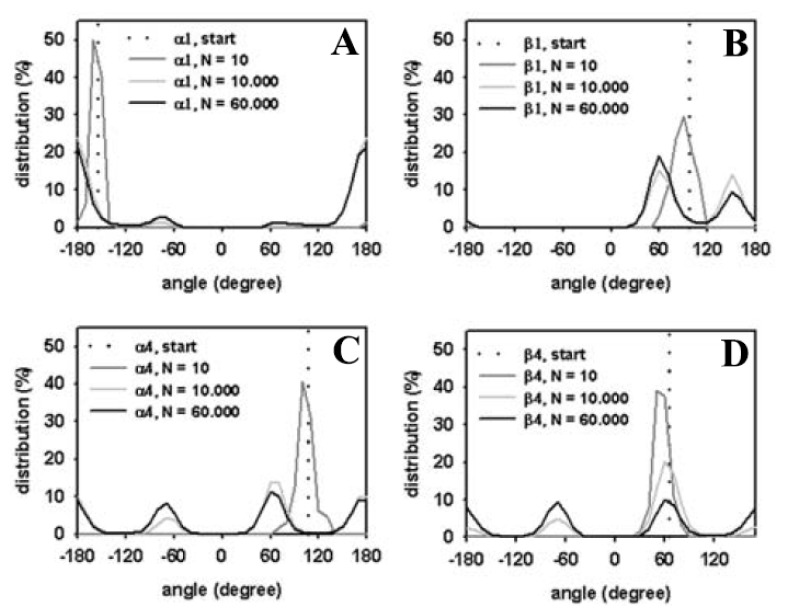
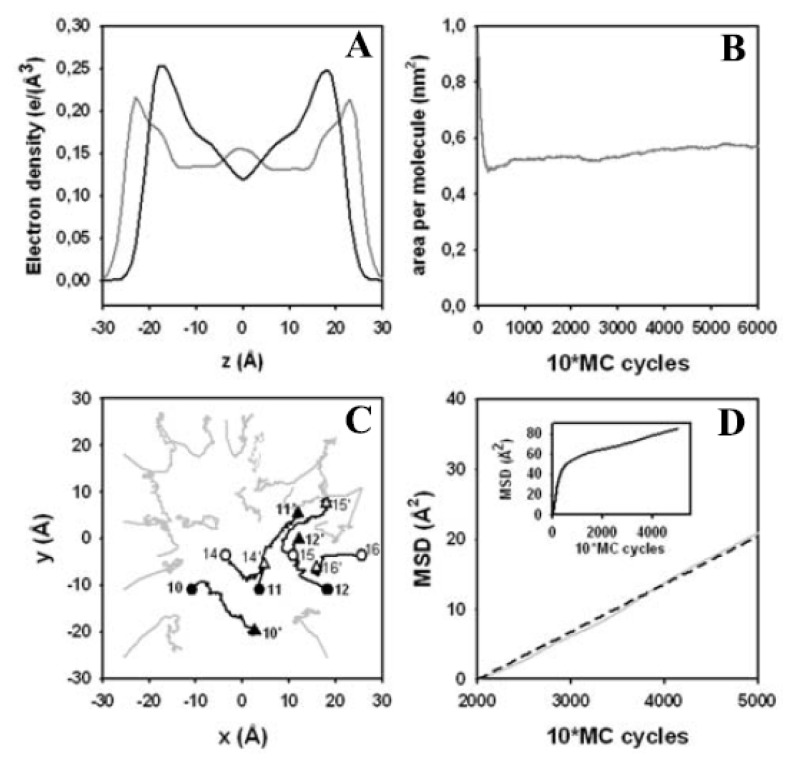
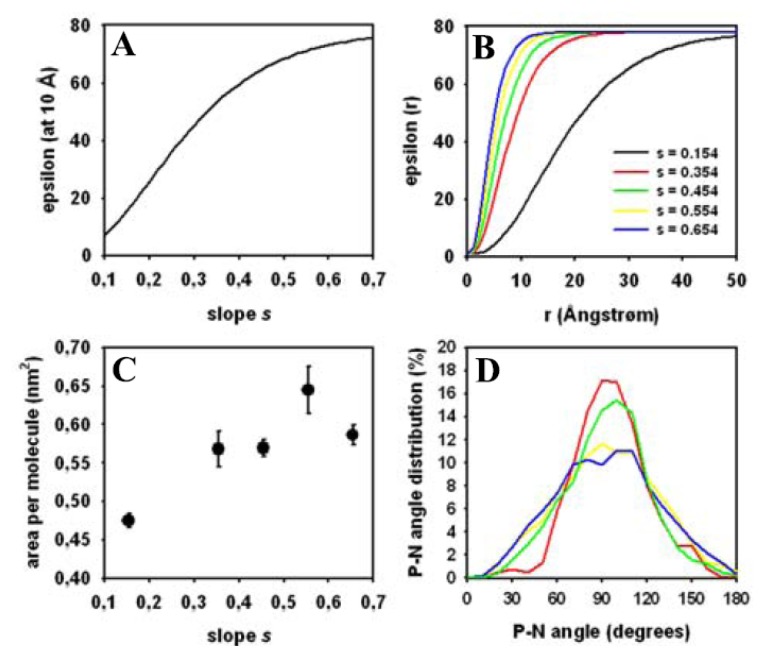
Biological membranes are complex assemblies of many different molecules of which analysis demands a variety of experimental and computational approaches. In this article, we explain challenges and advantages of atomistic Monte Carlo (MC) simulation of lipid membranes. We provide an introduction into the various move sets that are implemented in current MC methods for efficient conformational sampling of lipids and other molecules. In the second part, we demonstrate for a concrete example, how an atomistic local-move set can be implemented for MC simulations of phospholipid monomers and bilayer patches. We use our recently devised chain breakage/closure (CBC) local move set in the bond-/torsion angle space with the constant-bond-length approximation (CBLA) for the phospholipid dipalmitoylphosphatidylcholine (DPPC). We demonstrate rapid conformational equilibration for a single DPPC molecule, as assessed by calculation of molecular energies and entropies. We also show transition from a crystalline-like to a fluid DPPC bilayer by the CBC local-move MC method, as indicated by the electron density profile, head group orientation, area per lipid, and whole-lipid displacements. We discuss the potential of local-move MC methods in combination with molecular dynamics simulations, for example, for studying multi-component lipid membranes containing cholesterol.


Figures

Figure 1.
Figure 1.
Molecular model of DPPC for atomistic Monte Carlo simulation. A united atom representation of dipalmitoylphosphatidylcholine (DPPC), which neglects hydrogen atoms, is employed reducing the number of atoms per DPPC molecule to 50 [81].
Figure 2.
Figure 2.
Snapshot and energy of a single-molecule Monte Carlo simulation. (A) starting conformation (start) and representative snapshots of a single molecule MC simulation are shown after 1·× 105 and 1·× 106 MC steps. Large conformational moves of the fatty acyl chains and the lipid head group can be observed; (B) mean system energy equivalent to the conformational energy calculated from the AMBER force field during the simulation [85]. The conformational energy becomes stable already after about 750,000 MC steps. The inset shows the initial phase of energy equilibration with a maximum after about 20,000 MC steps; (C) histogram of the conformational energy of the last one million MC steps (grey bars) overlaid with a fit to a Gaussian function of the form f(E)=A·exp(((Ei-E)/2·σ)2) providing the mean energy at equilibrium, E, and the standard deviation, σ, as a measure of fluctuations around the mean value (red line). See text for further explanation.
Figure 3.
Figure 3.
Covariance, conformational entropy and free energy of a single DPPC molecule. (A) from trajectories of single molecule simulations the covariance matrix of atomic positions was calculated and plotted as a 150 × 150 matrix for 100 (=0.1), 2,000 (“2”), 20,000 (“20”), 200,000 (“200”), one million (“1000”), and two million (“2000”) MC steps, respectively. Dark and light spots indicate high and low values of (co-)variances, respectively. The matrix values do not change grossly after 1 million MC steps with low off-diagonal values (i.e., covariances). This indicates equilibration of the structural sampling and absence of significant correlations of fluctuations of adjacent atoms in the DPPC molecule; (B) the conformational entropy was calculated from the mass-weighted covariance matrix after a given number of MC steps, as described in the text; (C) the conformational free energy was calculated as F = ET·S with E and S being the conformational (internal) energy and entropy, respectively. The temperature of the simulation was 323 K (i.e., 50 °C).
Figure 4.
Figure 4.
Distribution of DPPC head group dihedral angles from a single-molecule simulation. Head group torsions were defined as in Vanderkooi et al. [84] with the starting value defined by the initial conformation (dotted lines, “start”; compare Figure 2A). The percentage of occupation was calculated as function of torsion angle (in degree) after 1000 (“N = 1”, red line), 10,000 (“N = 10”, blue line), one million (“N = 1000”, green line), and two million (“N = 2000”, pink line) MC steps, respectively. The dihedral angles are defined as (A) torsions around atom 6 and 7 (α1); (B) atom 5 and 6 (α2); (C) atom 4 and 5 (α3); (D) atom 3 and 4 (α4); (E) atom 2 and 3 (α5); and (F) atom 1 and 2 (α6), respectively (compare Figure 2 for atom numbering in the DPPC molecule).
Figure 5.
Figure 5.
Simulation snapshot and system energy of a DPPC bilayer. The membrane simulation started from a crystalline bilayer consisting of 32 DPPC molecules with straight fatty acyl chains in each leaflet. Each molecule was rotated by a random rotation angle around the molecular long axis in the start configuration ((A), “N = 0”); (BD) show snapshots after N = 10,000 (B); N = 20,000 (C); and N = 40,000 (D) MC steps, respectively. United atoms of methyl and methylen as well as carbon atoms are shown in grey, oxygen in red, nitrogen in blue, and phosphorus in yellow. Fatty acyl chains become increasingly disordered in course of the simulation; (E) the enthalpy of the bilayer in the implicit solvent was calculated after a given number of MC steps of the simulation performed in the constant NPT-ensemble. The temperature of the simulation was 323 K (i.e., 50 °C); (F) a histogram of the conformational energy of the last 40,000 MC steps (grey bars) overlaid with a fit to a Gaussian function of the form f(E)=A·exp(((Ei-E)/2·σ)2) provides the mean energy at equilibrium, E, and the standard deviation, σ, as a measure of fluctuations around the mean value (light grey line). See text for further explanation.
Figure 6.
Figure 6.
Head group torsions of DPPC in the membrane. Head group dihedral angles were defined as in Vanderkooi et al. [84], and as given in the legend to Figure 5. The starting value is defined by the initial conformation (dotted lines, “start”; compare Figure 2A). The percentage of occupation was calculated as function of torsion angle (in degree) after 10 (“N = 10”, dark grey line), 10,000 (“N = 10,000”, light grey line), 60,000 (“N = 60,000”, black line) MC steps, respectively. (A) shows the torsion around the bond connecting atoms 6 and 7 (α1); (B) around the bond connecting atoms 8 and 9 (β1) (C) around the bond connecting atoms 3 and 4 (α4) and (D) is the torsion angle distribution around the bond connecting atoms 11 and 12 (β4).
Figure 7.
Figure 7.
Electron density profile, area per lipid and lateral displacement in the bilayer. (A) the electron density profile was calculated for the starting configuration (grey line) and for the structure obtained after 60,000 MC steps (black line). One can clearly see that the membrane gets thinner with a large extent of fatty acyl chain disorder towards the bilayer center during the simulation; (B) the change of area per lipid from the crystalline start structure to the equilibrated value after 60,000 MC steps is shown; (C) a stroboscopic snapshot of selected lipid trajectories is shown for the upper leaflet during an MC simulation of 50,000 MC steps (lipid number X and X′ at the start, circles, and the end of the simulation, triangles). The position of the center of mass of the lipids is calculated. After adjustment of the box size causing initially large inward-directed “movement” of most lipids, the lipids show irregular “movement” as being characteristic for random walks (i.e., diffusion); (D) the mean square displacement (MSD) was calculated between 20,000 and 50,000 MC steps. The MSD is linear (light grey line) and can be well described by a linear fit (dashed black line), as characteristic for normal diffusion (see text for values). Inset shows the MSD as function of MC steps (“10*MC cycles”) for the whole simulation.
Figure 8.
Figure 8.
Impact of electrostatic interactions on membrane structure. (A) the distance-dependent dielectric constant is plotted as function of the slope, s, as defined in Equation (7) for a fixed distance from a charged group of 10 Å; (B) the distance-dependent dielectric constant is plotted as function of the distance from a charged group for various slope values of s = 0.154 (black line), s = 0.354 (red line), s = 0.454 (green line), s = 0.554 (yellow line), and s = 0.654 (blue line), respectively; (C) the area per lipid was calculated from the least 40,000 steps of separate MC runs performed with differing slope values of the dielectric constant. The mean ± SD is plotted as function of slope, s; (D) the head group orientation was inferred from the angle between the P–N vector and the bilayer normal and plotted for the separate MC runs. Increasing the slope, s, of the dielectric constant resulted in a broadening of the angle distribution (color coding is as for panel B). See text for more details.

Similar articles

Cited by

References

    1. Baumgart T., Hess S.T., Webb W.W. Imaging coexisting fluid domains in biomembrane models coupling curvature and line tension. Nature. 2003;425:821–824. - PubMed
    1. Korlach J., Schwille P., Webb W.W., Feigenson G.W. Characterization of lipid bilayer phases by confocal microscopy and fluorescence correlation spectroscopy. Proc. Natl. Acad. Sci. USA. 1999;96:8461–8466. - PMC - PubMed
    1. Gliss C., Randel O., Casalta H., Sackmann E., Zorn R., Bayerl T. Anisotropic motion of cholesterol in oriented DPPC bilayers studied by quasielastic neutron scattering: The liquid-ordered phase. Biophys. J. 1999;77:331–340. - PMC - PubMed
    1. Li Y., Ge M., Ciani L., Kuriakose G., Westover E.J., Dura M., Covey D.F., Freed J.H., Maxfield F.R., Lytton J., et al. Enrichment of endoplasmic reticulum with cholesterol inhibits sarcoplasmic-endoplasmic reticulum calcium ATPase-2b activity in parallel with increased order of membrane lipids: Implications for depletion of endoplasmic reticulum calcium stores and apoptosis in cholesterol-loaded macrophages. J. Biol. Chem. 2004;279:37030–37039. - PubMed
    1. Oradd G., Westerman P.W., Lindblom G. Lateral diffusion coefficients of separate lipid species in a ternary raft-forming bilayer: A Pfg-NMR multinuclear study. Biophys. J. 2005;89:315–320. - PMC - PubMed

Publication types

LinkOut - more resources