. 2014 Apr;34(7):1271-9.
doi: 10.1128/MCB.01203-13. Epub 2014 Jan 27.

Insulin stimulates syntaxin4 SNARE complex assembly via a novel regulatory mechanism

Affiliations

Insulin stimulates syntaxin4 SNARE complex assembly via a novel regulatory mechanism

Dimitrios Kioumourtzoglou et al. Mol Cell Biol. 2014 Apr.

Abstract

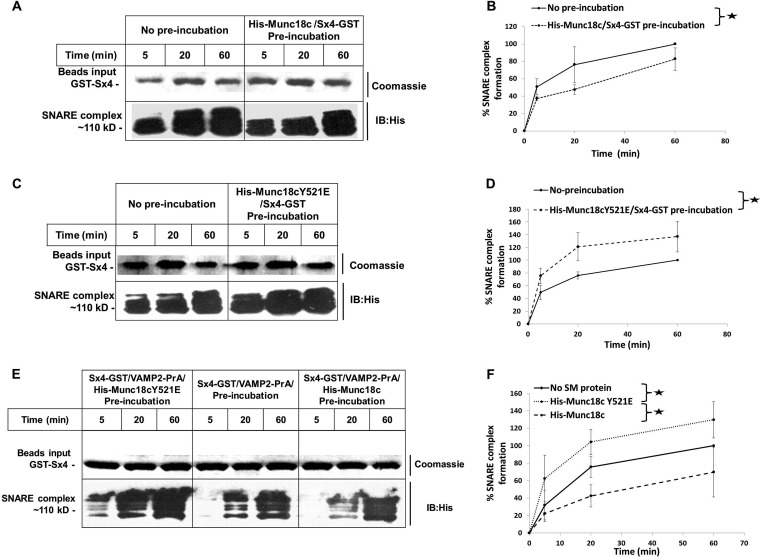
Insulin stimulates glucose transport into fat and muscle cells by increasing the exocytic trafficking rate of the GLUT4 facilitative glucose transporter from intracellular stores to the plasma membrane. Delivery of GLUT4 to the plasma membrane is mediated by formation of functional SNARE complexes containing syntaxin4, SNAP23, and VAMP2. Here we have used an in situ proximity ligation assay to integrate these two observations by demonstrating for the first time that insulin stimulation causes an increase in syntaxin4-containing SNARE complex formation in adipocytes. Furthermore, we demonstrate that insulin brings about this increase in SNARE complex formation by mobilizing a pool of syntaxin4 held in an inactive state under basal conditions. Finally, we have identified phosphorylation of the regulatory protein Munc18c, a direct target of the insulin receptor, as a molecular switch to coordinate this process. Hence, this report provides molecular detail of how the cell alters membrane traffic in response to an external stimulus, in this case, insulin.


Figures

FIG 1
FIG 1
Pairwise associations between syntaxin4, SNAP23, VAMP2, and Munc18c in 3T3-L1 adipocytes in the presence and absence of insulin stimulation. PLA results of pairwise associations between Sx4, SNAP23, VAMP2, and Munc18c in 3T3-L1 adipocytes treated with 100 nM insulin for 5 min or not treated (basal) are shown in red (blue = DAPI [4′,6-diamidino-2-phenylindole]). Controls omitting the first listed primary antibody are shown for each pairwise combination. Statistical analyses of PLA results were performed using Blobfinder and SPSS software. Box plots represent median numbers of signals per cell from 30 to 100 cells per experiment (y axis; blue = basal, red = insulin). Images are representative of the results of 3 independent experiments. For all control experiments, the PLA signal value was <1 per cell. Signal obtained in the presence of both primary antibodies was found to be significantly greater than that obtained in controls for all combinations shown (P < 0.001).
FIG 2
FIG 2
Direct interaction between the cytosolic domain of VAMP2 and the SNARE motif of syntaxin4. (A) A 10-μg amount of VAMP2-PrA or PrA bound to IgG-Sepharose (10-μl bed volume) was incubated with a 10× molar excess of the cytosolic domain of Sx4 (cleaved from GST-Sx4) in 1 ml PBS at 4°C for the indicated times. Beads were washed with PBS prior to resuspension in Laemmli sample buffer (LSB) and heating to 95°C for 5 min. Eluted proteins were subjected to SDS-PAGE using a 15% separating gel and visualized by immunoblot (IB) analysis using anti-Sx4 antibody (which recognizes both Sx4 and PrA moieties). (B) A 30-μg amount of Sx4-GST or GST bound to glutathione-Sepharose beads (10-μl bed volume) was incubated with a 10× molar excess of VAMP2-PrA, Snc2-PrA, or PrA in 1 ml PBS at 4°C for 2 h. Beads were washed using PBS prior to resuspension in LSB and heating to 95°C for 5 min. Eluted proteins were subjected to SDS-PAGE using a 15% separating gel and visualized by Coomassie blue staining and immunoblot analysis (which recognizes all PrA moieties). VAMP2-PrA and Snc2-PrA were loaded for reference. (C to E) A 10- to 30-μg amount of Sx4-GST, ΔN36Sx4-GST, openSx4-GST, GST-ΔHabcSx4, or GST bound to glutathione-Sepharose beads (10-μl bed volume) was incubated with a 10× molar excess of the cytosolic domain of VAMP2 (cleaved from GST-VAMP2) in 1 ml PBS at 4°C for the indicated times. Beads were then washed using PBS prior to resuspension in LSB and heating to 95°C for 5 min. Eluted proteins were subjected to SDS-PAGE using a 15% separating gel and subjected to Coomassie blue staining to visualize the input GST proteins and to immunoblot analysis using anti-VAMP2 antibody to estimate the amount of VAMP2 bound. (F) Comparison of the abilities of Sx4-GST and mutants thereof to bind the cytosolic portion of VAMP2 (C to E). The proportion of VAMP2 pulled down by the different versions of Sx4-GST (expressed as a percentage of maximum binding) is plotted as a function of time. Error bars represent the standard deviations of the variable percentage (VAMP2) of the maximum signal intensity values determined in 3 independent experiments (data, expressed as the area under the curve, were statistically analyzed in pairs using a two-tailed t test; stars indicate P < 0.05).
FIG 3
FIG 3
In vitro SNARE complex formation. (A) A 100- to 500-μg amount of the purified cytosolic domain of Sx4 (cleaved from GST-Sx4) was incubated in a 0.5-ml volume of PBS with GST-VAMP2 (lanes 1 to 3) or His-SNAP23 (lanes 4 to 6) or in PBS alone (lanes 7 to 12) for 2 h at 4°C. A 100- to 500-μg amount of the following proteins was then added in a final volume of 1 ml PBS containing 10 μg BSA: lanes 1 to 3, His-SNAP23; lanes 4 to 6, GST-VAMP2; lanes 7 to 9, His-SNAP23 and GST-VAMP2; lanes 10 to 12, His-SNAP23 and GST alone. Reaction mixtures were incubated at 37°C with mixing, and samples (100 μl) were taken after 5, 15, and 30 min as indicated. Following addition of LSB, samples were heated to 95°C for 10 min prior to SDS-PAGE using a 15% separating gel and Coomassie staining (upper panel) and immunoblot analysis using anti-VAMP2 antibody (lower panel). The protein marker included is Bio-Rad Precision Plus protein standards; the bands are, from the top, 100, 75, 50, 37, 25, and 20 kDa. (B) Quantification of SNARE complex formation data from panel A plotted as percentage of maximum complex formation against time. Error bars represent standard deviations of the variable percentage (SNARE complex) of the maximum signal intensity values from 3 independent experiments (data, expressed as the area under the curve, were statistically analyzed in pairs using a two-tailed t test; stars indicate P < 0.05).
FIG 4
FIG 4
Effect of Munc18c on syntaxin4/SNAP23/VAMP2 SNARE complex formation. A 30- to 50-μg amount of Sx4-GST bound to glutathione-Sepharose (10-μl bed volume) was preincubated for 2 h at 4°C in a 1-ml volume with a 10× molar excess of His-Munc18c (A) or His-Munc18cY521E (C) or PBS alone (no preincubation) prior to washing with PBS and resuspension in 1 ml PBS containing His-SNAP23 and VAMP2-PrA each in 10× molar excess. (E) Alternatively, Sx4-GST was preincubated in 1 ml PBS containing a 10× molar excess of VAMP2-PrA and His-Munc18c, Munc18cY521E, or no Munc18c for 2 h at 4°C prior to addition of a 10× molar excess His-SNAP23. In all cases, reaction mixtures were incubated at 4°C for the indicated times and beads were washed extensively using PBS prior to the addition of 50 μl 2× LSB and heating to 95°C for 5 min. Samples were subjected to SDS-PAGE using a 15% separating gel and visualized by Coomassie blue staining (upper panels [to control for equal input levels of Sx4-GST]) or immunoblot analysis using anti-His6 antibody (lower panel). Immunoreactivity at ∼110 kDa corresponds to an SDS-resistant ternary complex containing Sx4-GST/His-SNAP23/VAMP-PrA (see Fig. S3-1 in the supplemental material). Data presented in panels A, C, and E are quantified in panels B, D, and F, respectively, with the proportion of SNARE complex formed expressed as a percentage of the maximum amount detected in the “No-preincubation” sample (B and D) or the no-SM (Sx4-GST/VAMP2-PrA-alone preincubation) sample (F), plotted as a function of time. Error bars represent standard deviations of the variable percentage (SNARE complex) of the maximum signal intensity values from 3 independent experiments (data, expressed as the area under the curve, were statistically analyzed in pairs using a two-tailed t test; stars indicate P < 0.05).

Similar articles

Cited by

References

    1. Bryant NJ, Govers R, James DE. 2002. Regulated transport of the glucose transporter GLUT4. Nat. Rev. Mol. Cell Biol. 3:267–277. 10.1038/nrm782 - DOI - PubMed
    1. Bryant NJ, Gould GW. 2011. SNARE proteins underpin insulin-regulated GLUT4 traffic. Traffic 12:657–664. 10.1111/j.1600-0854.2011.01163.x - DOI - PubMed
    1. Ungar D, Hughson FM. 2003. Snare protein structure and function. Annu. Rev. Cell Dev. Biol. 19:493–517. 10.1146/annurev.cellbio.19.110701.155609 - DOI - PubMed
    1. Aran V, Bryant NJ, Gould GW. 2011. Tyrosine phosphorylation of Munc18c on residue 521 abrogates binding to Syntaxin 4. BMC Biochem. 12:19. 10.1186/1471-2091-12-19 - DOI - PMC - PubMed
    1. Jewell JL, Oh E, Ramalingam L, Kalwat MA, Tagliabracci VS, Tackett L, Elmendorf JS, Thurmond DC. 2011. Munc18c phosphorylation by the insulin receptor links cell signaling directly to SNARE exocytosis. J. Cell Biol. 193:185–199. 10.1083/jcb.201007176 - DOI - PMC - PubMed

Publication types

MeSH terms