. 2014 Mar 14;289(11):7812-24.
doi: 10.1074/jbc.M113.537563. Epub 2014 Jan 27.

Structural insights into neonatal Fc receptor-based recycling mechanisms

Affiliations

Structural insights into neonatal Fc receptor-based recycling mechanisms

Vaheh Oganesyan et al. J Biol Chem. .

Abstract

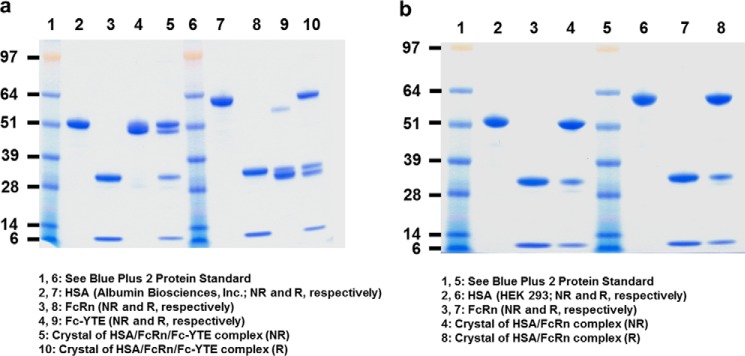
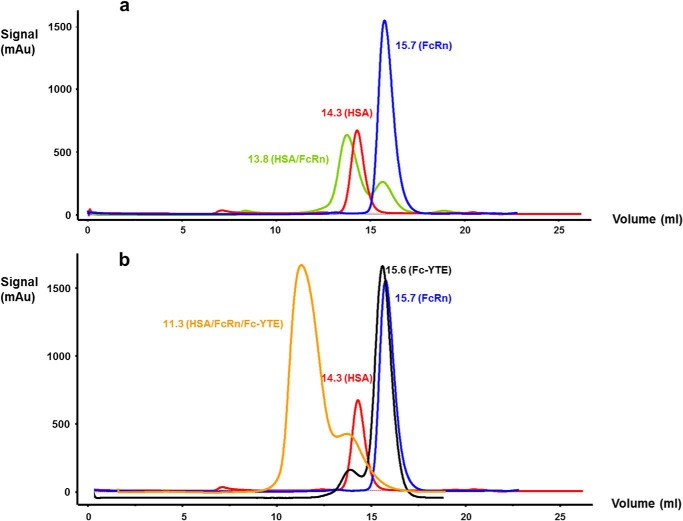
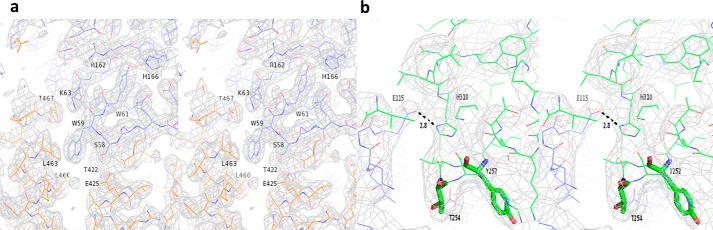
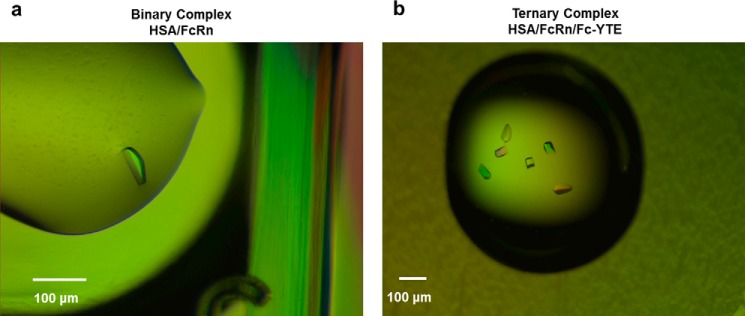
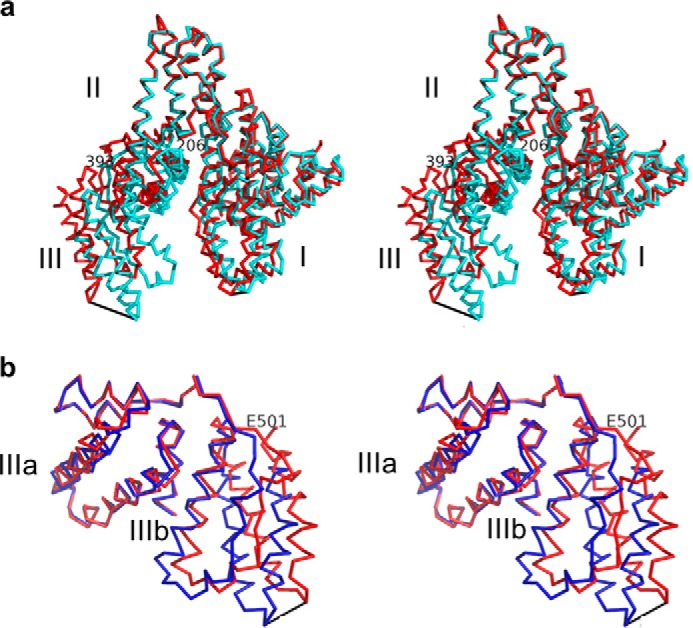
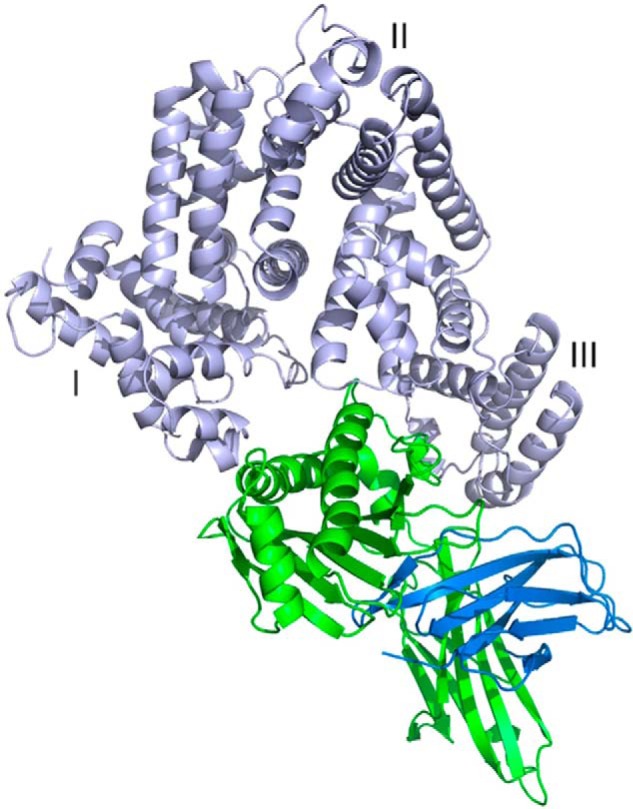
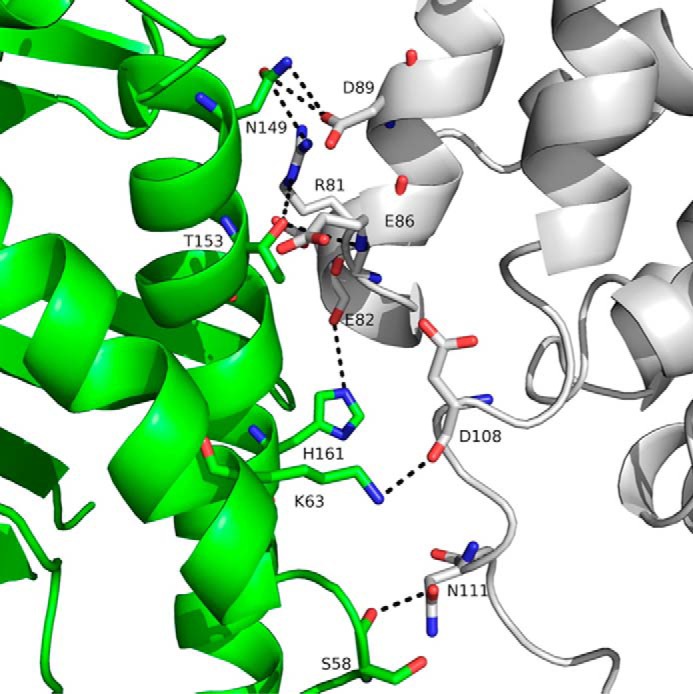
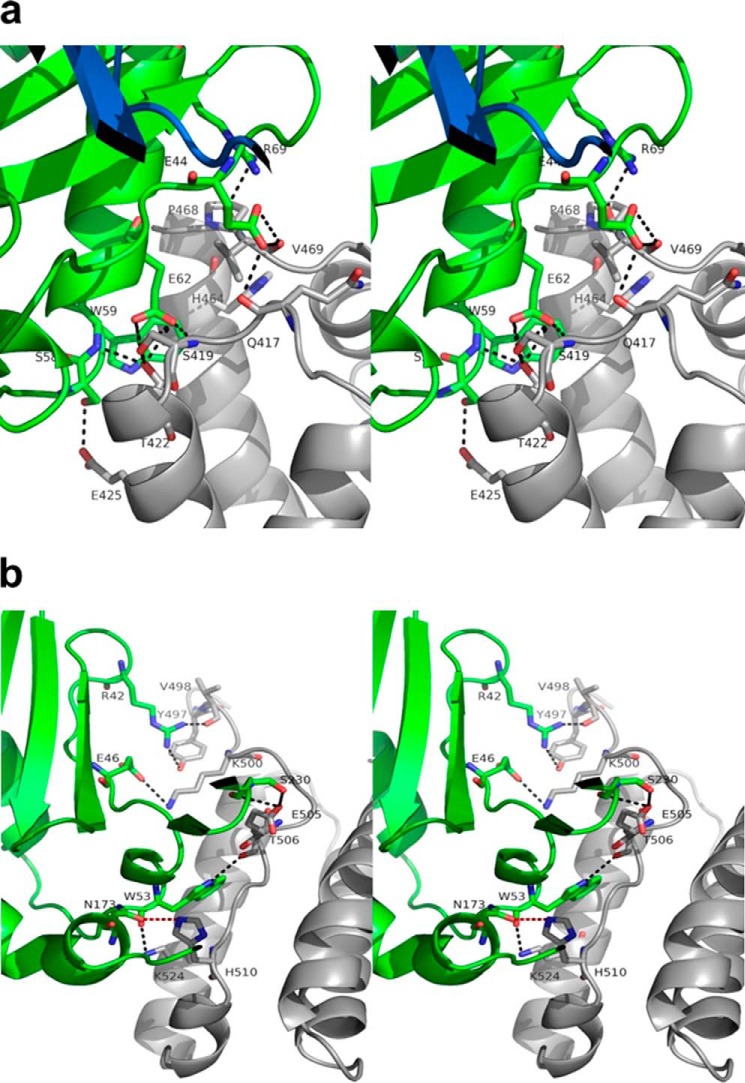
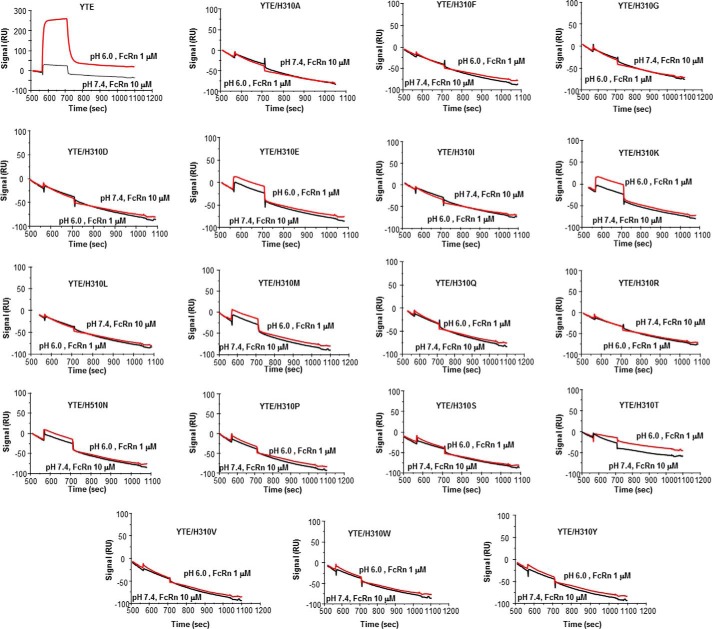
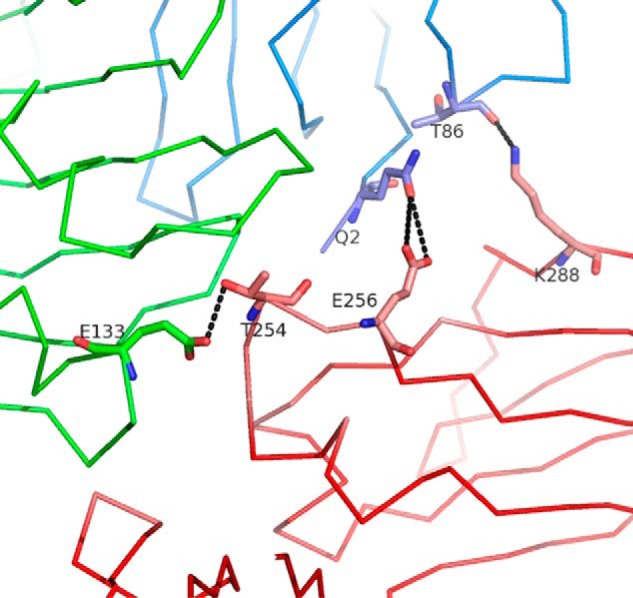
We report the three-dimensional structure of human neonatal Fc receptor (FcRn) bound concurrently to its two known ligands. More particularly, we solved the crystal structure of the complex between human FcRn, wild-type human serum albumin (HSA), and a human Fc engineered for improved pharmacokinetics properties (Fc-YTE). The crystal structure of human FcRn bound to wild-type HSA alone is also presented. HSA domain III exhibits an extensive interface of contact with FcRn, whereas domain I plays a lesser role. A molecular explanation for the HSA recycling mechanism is provided with the identification of FcRn His(161) as the only potential direct contributor to the corresponding pH-dependent process. At last, this study also allows an accurate structural definition of residues considered for decades as important to the human IgG/FcRn interaction and reveals Fc His(310) as a significant contributor to pH-dependent binding. Finally, we explain various structural mechanisms by which several Fc mutations (including YTE) result in increased human IgG binding to FcRn. Our study provides an unprecedented relevant understanding of the molecular basis of human Fc interaction with human FcRn.

Keywords: Albumin; Antibodies; Crystal Structure; FC Receptors; Protein Complexes.


Figures

FIGURE 1.
FIGURE 1.
SDS-PAGE profile under reducing (R) and non-reducing (NR) conditions of (a) HSA (Albumin Biosciences, Inc.), FcRn, Fc-YTE and dissolved crystals of the HSA·FcRn·Fc-YTE complex, and (b) HSA (HEK 293-produced), FcRn and dissolved crystals of the HSA·FcRn complex. Although HSA has a predicted molecular mass of ∼65 kDa, it migrated at ∼60 and 50 kDa under R and NR conditions, respectively. This difference is likely attributable to the presence of 17 internal disulfide bonds, the differential reduction of which alters the compactness (and thus the migration) of the molecule. Fc-YTE migrated at ∼30 and 50 kDa under R and NR conditions, respectively, because of the presence of an expected interchain disulfide bond in its hinge region. Fc-YTE under R conditions seemed to run slightly slower than the expected ∼25 kDa. We attribute this difference to the presence of carbohydrates at a canonical N-glycosylation site (Asn297). Under NR conditions, this glycosylation effect is likely counterbalanced by the presence of one inter- and four intra-chain disulfide bonds that increase the compactness of the molecule, thereby accounting for an overall migration at the expected ∼50 kDa. FcRn migrated as expected as two bands corresponding to its α- and β2-microglobulin chains at ∼30 and 10 kDa, respectively (under both R and NR conditions).
FIGURE 2.
FIGURE 2.
Superimposition of the size exclusion chromatograms of (a) HSA (HEK 293-produced), FcRn and HSA/FcRn complex, and (b) HSA (Albumin Biosciences, Inc.), FcRn, Fc-YTE, and HSA·FcRn·Fc-YTE complex.
FIGURE 3.
FIGURE 3.
Stereographic representation of the final σA weighted electron density. Map around (a) the FcRn hydrophobic core at the HSA DIII/FcRn interface in the binary complex, and (b) the M252Y and S254T mutations (shown as green sticks) in the ternary complex. The maps are contoured at 1.0σ.
FIGURE 4.
FIGURE 4.
Crystals of (a) HSA/FcRn and (b) HSA·FcRn·Fc-YTE complexes. The binary complex crystals grew to a size of up to 50 × 50 × 20 μm within 3–4 days at room temperature. The ternary complex crystals grew to a size of up to 50 × 50 × 100 μm within 4 weeks at room temperature.
FIGURE 5.
FIGURE 5.
a, stereographic representation of the superimposition of full-length HSA of this study (red) with HSA corresponding to PDB entry 1AO6 (32) (blue). Superimposition was carried out through the Cα atoms of HSA DII. HSA DIII exhibits the largest change in orientation relative to other domains, with a maximum motion of 19.1 Å between the Cα atoms of Asp562. HSA DI motion was more modest with a maximum distance of 5.0 Å between the Cα atoms of Ala172. Pivot points for DI and DIII were found at Phe206 and Glu393, respectively. b, stereographic representation of the superimposition of HSA DIII of this study (red) with HSA DIII corresponding to PDB entry 1AO6 (32) (blue). The superimposition was carried out through the Cα atoms of HSA DIIIa. Significant variability in the relative orientation of HSA DIIIa and DIIIb was seen, with a maximum distance of 8.5 Å between the Cα atoms of Asp562. The pivot point was found at Glu501. This and all other figures were made using PyMOL (DeLano Scientific, Palo Alto, CA).
FIGURE 6.
FIGURE 6.
Three-dimensional view of HSA·FcRn complex. HSA (DI, DII, and DIII), FcRn α-chain and β2-microglobulin are shown in light blue, green, and dark blue, respectively. FcRn binds in a HSA crevice located between DI and DIII.
FIGURE 7.
FIGURE 7.
Three-dimensional representation of the interface between HSA DI (gray) and human FcRn α-chain (green). HSA DI is positioned directly above the longer portion of the FcRn groove. Although FcRn His161 is in a favorable position to create a hydrogen bond with the carbonyl of HSA Glu82, its contribution is likely minimal because of its rather large distance (∼4 Å). Possible charged interactions are indicated by black dotted lines.
FIGURE 8.
FIGURE 8.
Stereographic representation of the interface between (a) HSA DIIIa and human FcRn, and (b) HSA DIIIb and human FcRn. a, the interface with HSA DIIIa is the busiest and most likely a major determinant for the affinity of the corresponding complex. It does not, however, contain any histidine residues and therefore does not contribute to the pH dependence of the interaction. Possible charged interactions are indicated by dotted lines. HSA, FcRn α-chain, and β2-microglobulin are shown in gray, green, and dark blue, respectively. b, HSA His510 in DIIIb forms a strong hydrogen bond with FcRn Asn173/Oδ1 (red dotted line). Possible charged interactions are indicated by black dotted lines. HSA and FcRn α-chain are shown in gray and green, respectively.
FIGURE 9.
FIGURE 9.
BIAcore analysis of the binding of HSA wild-type and variants to human FcRn at pH 6.0 and 7.4 after correction for nonspecific binding.
FIGURE 10.
FIGURE 10.
Stereographic representation of the interface between HSA IIIb and β2-microglobulin. Contribution of β2-microglobulin to HSA binding is limited to long range (∼3.7–4.0 Å) charged interactions (indicated by dotted lines). HSA, FcRn α-chain, and β2-microglobulin are shown in light blue, green, and dark blue, respectively.
FIGURE 11.
FIGURE 11.
Three-dimensional view of the HSA·FcRn·Fc-YTE complex. HSA (DI, DII, and DIII), FcRn α-chain, β2-microglobulin, and Fc-YTE are shown in light blue, green, dark blue, and brown, respectively. The content of the asymmetric unit is shown in the red rectangle.
FIGURE 12.
FIGURE 12.
Stereographic representation of the interface between Fc-YTE (pink) and FcRn α-chain (green). Fc-YTE His310/Nδ1 forms a strong hydrogen bond with FcRn Glu115/Oϵ1 (red dotted line). Other charged interactions are marked with black dotted lines.
FIGURE 13.
FIGURE 13.
BIAcore analysis of the binding of IgG-YTE and variants thereof to human FcRn at pH 6.0 and 7.4 after correction for nonspecific binding.
FIGURE 14.
FIGURE 14.
Three-dimensional view of the interface between Fc-YTE (pink), FcRn α-chain (green), and β2-microglobulin (blue) around Fc-YTE Glu256. The side chain of Glu256 allows additional interactions with β2-microglobulin Gln2 (dotted lines). Thr254/Oγ1 also interacts with FcRn Glu133/Oϵ1. These interactions likely contribute to the high affinity of Fc-YTE for FcRn.

References

    1. Simister N. E., Mostov K. E. (1989) An Fc receptor structurally related to MHC class I antigens. Nature 337, 184–187 - PubMed
    1. Burmeister W. P., Gastinel L. N., Simister N. E., Blum M. L., Bjorkman P. J. (1994) Crystal structure at 2.2-Å resolution of the MHC-related neonatal Fc receptor. Nature 372, 336–343 - PubMed
    1. Burmeister W. P., Huber A. H., Bjorkman P. J. (1994) Crystal structure of the complex of rat neonatal Fc receptor with Fc. Nature 372, 379–383 - PubMed
    1. Rodewald R. (1976) pH-dependent binding of immunoglobulins to intestinal cells of the neonatal rat. J. Cell Biol. 71, 666–669 - PMC - PubMed
    1. Raghavan M., Bonagura V. R., Morrison S. L., Bjorkman P. J. (1995) Analysis of the pH dependence of the neonatal Fc receptor/immunoglobulin G interaction using antibody and receptor variants. Biochemistry 34, 14649–14657 - PubMed