. 2014 Mar 7;289(10):6581-6591.
doi: 10.1074/jbc.M113.537852. Epub 2014 Jan 27.

Critical roles for Rictor/Sin1 complexes in interferon-dependent gene transcription and generation of antiproliferative responses

Affiliations

Critical roles for Rictor/Sin1 complexes in interferon-dependent gene transcription and generation of antiproliferative responses

Surinder Kaur et al. J Biol Chem. .

Abstract

We provide evidence that type I IFN-induced STAT activation is diminished in cells with targeted disruption of the Rictor gene, whose protein product is a key element of mTOR complex 2. Our studies show that transient or stable knockdown of Rictor or Sin1 results in defects in activation of elements of the STAT pathway and reduced STAT-DNA binding complexes. This leads to decreased expression of several IFN-inducible genes that mediate important biological functions. Our studies also demonstrate that Rictor and Sin1 play essential roles in the generation of the suppressive effects of IFNα on malignant erythroid precursors from patients with myeloproliferative neoplasms. Altogether, these findings provide evidence for critical functions for Rictor/Sin1 complexes in type I IFN signaling and the generation of type I IFN antineoplastic responses.

Keywords: Akt PKB; Antiviral Agents; Cell Signaling; Cytokines/Interferon; Gene Regulation; Interferon; Signal Transduction.


Figures
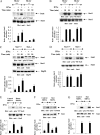
FIGURE 1.
FIGURE 1.
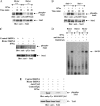
Type 1 IFN-induced phosphorylation of Ser STAT1 is Rictor and Sin1 dependent. A and B, Rictor+/+ or Rictor−/− MEFs were treated with IFNα for the indicated times, and equal amounts of protein were processed for Western blotting with anti-Ser727-STAT1 (A) or anti-Tyr701-STAT1 (B) antibodies. The blots in respective top panels were stripped and probed with an anti-STAT1 antibody. The signals for phospho-STAT1 and total STAT1 from three independent experiments (including the blots shown) were quantitated by densitometry, and the intensity of phospho-STAT1 relative to STAT1 was calculated. The data are expressed as means of ratios of phospho-STAT1/STAT1 ± S.E. for each experimental condition. C and D, Sin1+/+ or Sin1−/− MEFs were treated with IFNα for the indicated times, and equal amounts of protein were processed for Western blotting with anti-Ser727-STAT1 (C) or anti-Tyr701-STAT1 (D) antibodies. The blots in respective top panels were stripped and probed with an anti-STAT1 antibody or an anti-HSP90 antibody, as indicated. The signals for phospho-STAT1 and total STAT1 from three independent experiments (including the blots shown) were quantitated by densitometry and the intensity of phospho-STAT1 relative to STAT1 was calculated. The data are expressed as means of ratios of phospho-STAT1/STAT1 ± S.E. for each experimental condition. E, U937 cells stably infected with control shRNA or Rictor shRNA were treated with human IFNα as indicated. Equal protein aliquots were processed for immunoblotting with anti-Ser727-STAT1 antibody (top panel). The same blot was stripped and probed with an anti-STAT1 antibody (middle panel). The signals for phospho-STAT1 and total STAT1 from three independent experiments (including the blots shown) were quantitated by densitometry, and the intensity of phospho-STAT1 relative to STAT1 was calculated. The data are expressed as means of ratios of phospho-STAT1/STAT1 ± S.E. for each experimental condition (bottom panel). F and G, U937 cells transiently transfected with control siRNA or Sin1 siRNA were treated with human IFNα as indicated. Equal protein aliquots were processed for immunoblotting with anti-Ser727-STAT1 (F, top panel) or anti-Tyr701-STAT1 (G, top panel) antibody, as indicated. The respective blots were stripped and probed with an anti-STAT1 antibody (F and G, middle panels), as indicated. The signals for phospho-STAT1 and total STAT1 from three independent experiments (including the blots shown) were quantitated by densitometry, and the intensity of phospho-STAT1 relative to STAT1 was calculated. The data are expressed as means of ratios of phospho-STAT1/STAT1 ± S.E. for each experimental condition (F and G, bottom panels).
FIGURE 2.
FIGURE 2.
IFN-induced STAT2 phosphorylation and ISGF3 complex formation is Rictor- and Sin1-dependent. A, Rictor+/+ or Rictor−/− MEFs were treated with IFNα for the indicated times, and equal amounts of protein were processed for Western blotting with anti-Tyr689-STAT2 antibody (top panel). Equal amounts of protein were resolved in parallel on the same gel and processed for immunoblotting with anti-STAT2 antibody (bottom panel). B, Sin1+/+ or Sin1−/− MEFs were treated with IFNα for the indicated times, and equal amounts of protein were processed for Western blotting with anti-Tyr689-STAT2 antibody (top panel). Equal amounts of protein were resolved in parallel on the same gel and processed for immunoblotting with anti-STAT2 antibody (bottom panel). C, U937 cells stably infected with control shRNA or Rictor shRNA were treated with human IFNα as indicated. Equal protein aliquots were processed for immunoblotting with anti-Tyr-STAT2 antibody (top panel). The same blot was stripped and probed with an anti-STAT2 antibody (bottom panel). D, nuclear extracts were prepared from untreated or IFNα-treated Rictor+/+ and Rictor−/− MEFs and incubated with 32P-labeled synthetic ISRE. The protein-DNA complexes were resolved on a native PAGE, and complexes were detected by autoradiography. For antibody supershift experiments, protein extracts were incubated with the specified antibody or control nonimmune rabbit IgG, as indicated. E, U937 cells stably infected with control shRNA or Rictor shRNA were treated with human IFNα for 10 min. Equal protein aliquots were processed for immunoprecipitation with anti-Tyk2 or control IgG antibody as indicated. The immunoprecipitated proteins were processed for immunoblotting with anti-phospho-Tyk2 antibody (top panel). The same blot was stripped and probed with anti-Tyk2 antibody (bottom panel).
FIGURE 3.
FIGURE 3.
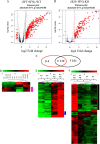
Differential expression of IFN regulated genes in the presence or absence of Rictor. Rictor+/+ (WT) and Rictor−/− MEFs were either left untreated or treated with IFNα for 24 h. The transcription profiles of Rictor+/+ and Rictor−/− cells were compared with transcription profiles of IFN-treated Rictor+/+ and Rictor−/− cells in three independent experiments, using MouseWG-6 v2.0 Illumina bead chips. Following normalization and removal of genes whose expression was absent or unchanged, differential gene expression was assessed with the regularized t test by comparing WT versus WT + IFN and KO versus KO + IFN, using a false discovery rate of ≤0.05 (33), together with an absolute log2 fold change threshold of ≥1. A and B, volcano plots of probes found differentially expressed after IFN treatment are shown. 404 probes (310 genes) were differentially expressed in IFN-treated Rictor+/+ cells (A). 163 probes (123 genes) were differentially expressed in IFN-treated Rictor−/− cells (B). Blue horizontal lines refer to a p value threshold of 0.05. Green and red vertical lines refer respectively to a −/+ log2 fold change threshold of 1. C, Venn diagram of the overlaps existing between genes found differentially expressed in Rictor−/− (red ellipse) and in Rictor+/+ (black ellipse) upon treatment with IFN. D, hierarchical clustering of probes differentially expressed only in Rictor−/− cells. The basal level of gene expression in Rictor−/− cells is different from that of Rictor+/+ cells, and in two of four genes, the treatment with IFN brings the expression level in Rictor−/− cells comparable to that observed in Rictor+/+ cell in the absence of IFN (violet gene cluster). E, hierarchical clustering of probes differentially expressed in both Rictor−/− and Rictor+/+ cells upon IFN treatment. The differences in the effects of IFN treatment are not dramatic between Rictor−/− and Rictor+/+ cells, except for the set of transcripts in the blue gene cluster, which are characterized by a less efficient IFN-driven expression in Rictor−/− cells (supplemental Table S1, 13 genes). F, hierarchical clustering of probes differentially expressed only in IFN-treated Rictor+/+ cells. The black gene cluster contains only genes that cannot be activated in Rictor−/− cells upon IFN treatment (supplemental Table S1, 81 genes).
FIGURE 4.
FIGURE 4.
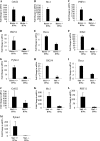
Requirement of Rictor and/or Sin1 for OAS2, Mx1, Phf11, Isg54, Daxx, Slfn2, and Pyhin1 expression. A–G, Rictor+/+ or Rictor−/− MEFs were treated with IFNα as indicated, and total RNA was isolated. Expression levels of the indicated genes were determined by real time RT-PCR, using β-actin for normalization. The data are expressed as fold change over untreated samples and represent means ± S.E. of six independent experiments for B–G and four experiments for A. H–M, Sin1+/+ or Sin1−/− MEFs were treated with IFNα for 24 h as indicated, and total RNA was isolated. Expression of Isg54, Daxx, OAS2, Mx1, PHF11, and Pyhin1 genes was determined by real time RT-PCR, using β-actin for normalization. The data are expressed as fold change over untreated samples and represent means ± S.E. of three experiments for Isg54 and Daxx and two experiments for OAS2, Mx1, PHF11, and Pyhin1.
FIGURE 5.
FIGURE 5.
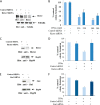
Essential roles for Rictor and Sin1 in the generation of the antineoplastic effects of IFNα. A, cell lysates from U937 cells stably infected with lentiviral control shRNA or Rictor shRNA were resolved by SDS-PAGE and then immunoblotted with an anti-Rictor antibody or anti-tubulin antibody as control. B, U937 cells stably infected with control shRNA or Rictor shRNA were processed for clonogenic assays in methylcellulose in the presence or absence of different doses of human IFNα, and leukemic CFU-L colonies were scored. The data are expressed as percentages of control untreated cells and represent means ± S.E. from four independent experiments. C, cell lysates from U937 cells transiently transfected with control siRNA or Rictor siRNA were resolved by SDS-PAGE and then immunoblotted with an anti-Rictor antibody (upper panel). The same blot was stripped and reprobed with an anti-Hsp90 antibody, as a loading control (lower panel). D, PBMCs from polycythemia vera patients were transfected with either control siRNA or Rictor siRNA. These cells were incubated in clonogenic assays in methylcellulose in the presence or absence of human IFNα. Malignant erythroid BFU-E progenitors were scored after 14 days in culture, and the data are expressed as percentages of untreated control siRNA derived colony formation and represent means ± S.E. of four independent experiments. E, cell lysates from U937 cells transiently transfected with control siRNA or Sin1 siRNA were resolved by SDS-PAGE then immunoblotted with an anti-Sin1 antibody (upper panel). The same blot was stripped and reprobed with an anti-Hsp90 antibody as a loading control, as indicated (lower panel). F, PBMCs from polycythemia vera patients were transfected with either control siRNA or Sin1 siRNA. The cells were incubated in clonogenic assays in methylcellulose in the presence or absence of human IFNα. Μalignant BFU-E erythroid progenitors were scored after 14 days in culture, and the data are expressed as percentages of untreated control siRNA derived colony formation and represent means ± S.E. of three independent experiments.

Similar articles

Cited by

References

    1. Dunn G. P., Koebel C. M., Schreiber R. D. (2006) Interferons, immunity and cancer immunoediting. Nat. Rev. Immunol. 6, 836–848 - PubMed
    1. Hervas-Stubbs S., Perez-Gracia J. L., Rouzaut A., Sanmamed M. F., Le Bon A., Melero I. (2011) Direct effects of type I interferons on cells of the immune system. Clin. Cancer Res. 17, 2619–2627 - PubMed
    1. Borden E. C., Sen G. C., Uze G., Silverman R. H., Ransohoff R. M., Foster G. R., Stark G. R. (2007) Interferons at age 50. Past, current and future impact on biomedicine. Nat. Rev. Drug Discov. 6, 975–990 - PMC - PubMed
    1. Stark G. R. (2007) How cells respond to interferons revisited. From early history to current complexity. Cytokine Growth Factor Rev. 18, 419–423 - PMC - PubMed
    1. Platanias L. C. (2013) Interferons and their antitumor properties. J. Interferon Cytokine Res. 33, 143–144 - PubMed

Publication types

MeSH terms

Substances