Transcription of the SCL/TAL1 interrupting Locus (Stil) is required for cell proliferation in adult Zebrafish Retinas
- PMID: 24469449
- PMCID: PMC3945354
- DOI: 10.1074/jbc.M113.506295
Transcription of the SCL/TAL1 interrupting Locus (Stil) is required for cell proliferation in adult Zebrafish Retinas
Abstract
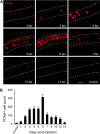
The human oncogene SCL/TAL1 interrupting locus (Stil) is highly conserved in vertebrate species. Previously, we identified a homolog of the Stil gene in zebrafish mutant (night blindness b, nbb), which showed neural defects in the retina (e.g. dopaminergic cell degeneration and/or lack of regeneration). In this research, we examined the roles of Stil in cell proliferation after degeneration in adult zebrafish retinas. We demonstrated that knockdown of Stil gene expression or inhibition of Sonic hedgehog (Shh) signaling transduction decreases the rate of cell proliferation. In contrast, activation of Shh signal transduction promotes cell proliferation. In nbb(+/-) retinas, inhibition of SUFU (a repressor in the Shh pathway) rescues the defects in cell proliferation due to down-regulation of Stil gene expression. The latter data suggest that Stil play a role in cell proliferation through the Shh signal transduction pathway.
Keywords: Cell Proliferation; Neurons; Oncogene; Retina; Zebrafish.
Figures


Similar articles
-
Functional expression of SCL/TAL1 interrupting locus (Stil) protects retinal dopaminergic cells from neurotoxin-induced degeneration.J Biol Chem. 2013 Jan 11;288(2):886-93. doi: 10.1074/jbc.M112.417089. Epub 2012 Nov 19. J Biol Chem. 2013. PMID: 23166330 Free PMC article.
-
Characterization of the human oncogene SCL/TAL1 interrupting locus (Stil) mediated Sonic hedgehog (Shh) signaling transduction in proliferating mammalian dopaminergic neurons.Biochem Biophys Res Commun. 2014 Jul 11;449(4):444-8. doi: 10.1016/j.bbrc.2014.05.048. Epub 2014 May 20. Biochem Biophys Res Commun. 2014. PMID: 24853807
-
The human oncogene SCL/TAL1 interrupting locus is required for mammalian dopaminergic cell proliferation through the Sonic hedgehog pathway.Cell Signal. 2014 Feb;26(2):306-12. doi: 10.1016/j.cellsig.2013.11.010. Epub 2013 Nov 12. Cell Signal. 2014. PMID: 24240054
-
Hedgehog signaling.Vitam Horm. 2012;88:1-23. doi: 10.1016/B978-0-12-394622-5.00001-8. Vitam Horm. 2012. PMID: 22391297 Review.
-
Stem Cell Leukemia: how a TALented actor can go awry on the hematopoietic stage.Leukemia. 2016 Oct;30(10):1968-1978. doi: 10.1038/leu.2016.169. Epub 2016 Jun 13. Leukemia. 2016. PMID: 27443261 Review.
Cited by
-
Midkine-a protein localization in the developing and adult retina of the zebrafish and its function during photoreceptor regeneration.PLoS One. 2015 Mar 24;10(3):e0121789. doi: 10.1371/journal.pone.0121789. eCollection 2015. PLoS One. 2015. PMID: 25803551 Free PMC article.
-
A novel function of the human oncogene Stil: Regulation of PC12 cell toxic susceptibility through the Shh pathway.Sci Rep. 2015 Nov 9;5:16513. doi: 10.1038/srep16513. Sci Rep. 2015. PMID: 26549353 Free PMC article.
-
The PLK4-STIL-SAS-6 module at the core of centriole duplication.Biochem Soc Trans. 2016 Oct 15;44(5):1253-1263. doi: 10.1042/BST20160116. Biochem Soc Trans. 2016. PMID: 27911707 Free PMC article. Review.
-
STIL mutation causes autosomal recessive microcephalic lobar holoprosencephaly.Hum Genet. 2015 Jan;134(1):45-51. doi: 10.1007/s00439-014-1487-4. Epub 2014 Sep 14. Hum Genet. 2015. PMID: 25218063
-
Regulating the formation of Müller glia-derived progenitor cells in the retina.Glia. 2025 Jan;73(1):4-24. doi: 10.1002/glia.24635. Epub 2024 Oct 24. Glia. 2025. PMID: 39448874 Free PMC article. Review.
References
-
- Aplan P. D., Lombardi D. P., Ginsberg A. M., Cossman J., Bertness V. L., Kirsch I. R. (1990) Disruption of the human scl locus by “illegitimate” v-(d)-j recombinase activity. Science 250, 1426–1429 - PubMed
-
- Collazo-Garcia N., Scherer P., Aplan P. (1995) Cloning and characterization of a murine SIL gene. Genomics 30, 506–513 - PubMed
-
- Izraeli S., Colaizzo-Anas T., Bertness V.L., Mani K., Aplan P. D., Kirsch I. R. (1997) Expression of the SIL gene is correlated with growth induction and cellular proliferation. Cell Growth Differ. 8, 1171–1179 - PubMed
-
- Izraeli S., Lowe L. A., Bertness V. L., Good D. J., Dorward D. W., Kirsch I. R., Kuehn M. R. (1999) The sil gene is required for mouse embryonic axial development and left-right specification. Nature 399, 691–694 - PubMed
Publication types
MeSH terms
Substances
Grants and funding
LinkOut - more resources
Full Text Sources
Other Literature Sources
Molecular Biology Databases
Research Materials
Miscellaneous

