. 2014 Mar 21;289(12):8170-81.
doi: 10.1074/jbc.M113.504159. Epub 2014 Jan 27.

Isoform- and species-specific control of inositol 1,4,5-trisphosphate (IP3) receptors by reactive oxygen species

Affiliations

Isoform- and species-specific control of inositol 1,4,5-trisphosphate (IP3) receptors by reactive oxygen species

Száva Bánsághi et al. J Biol Chem. .

Abstract

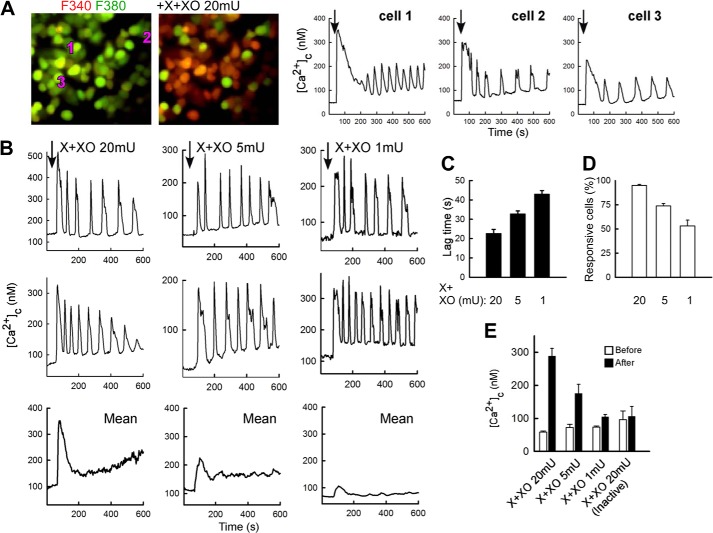
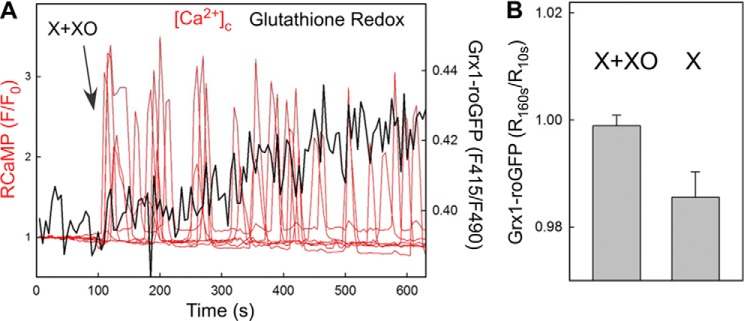
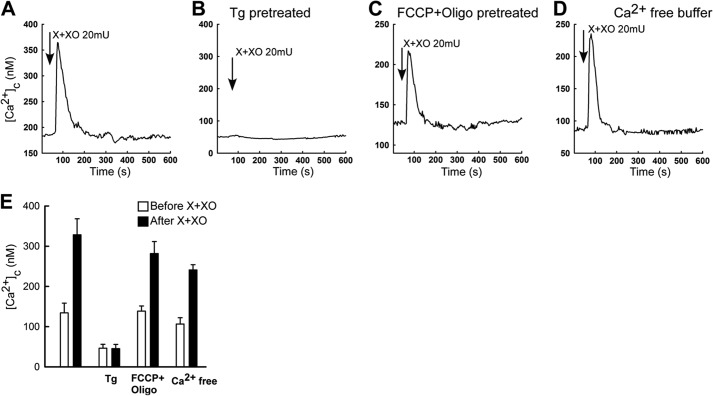
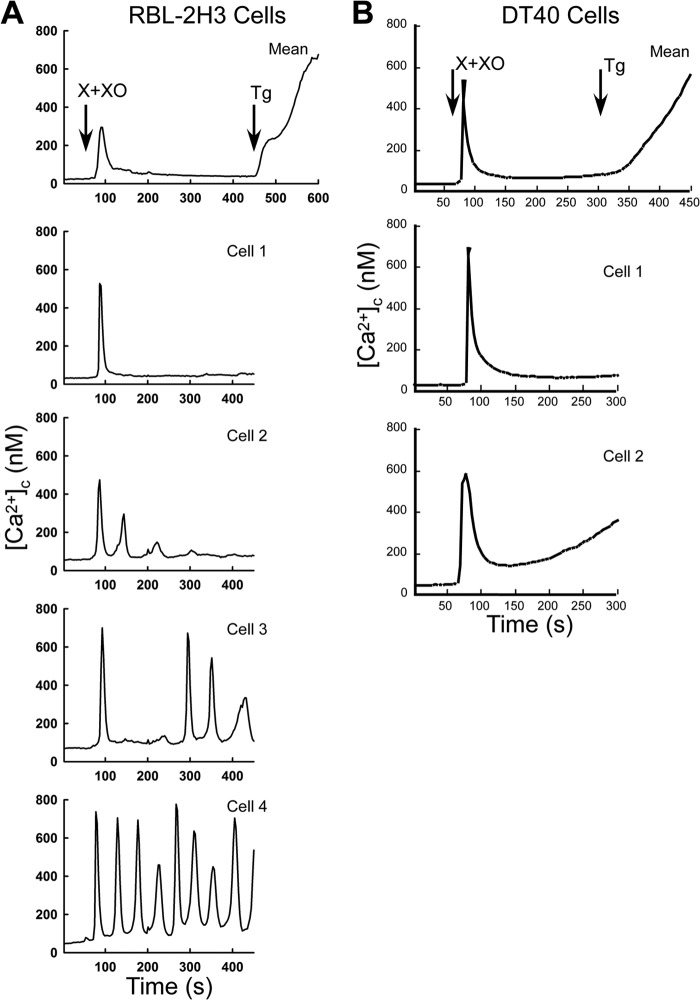
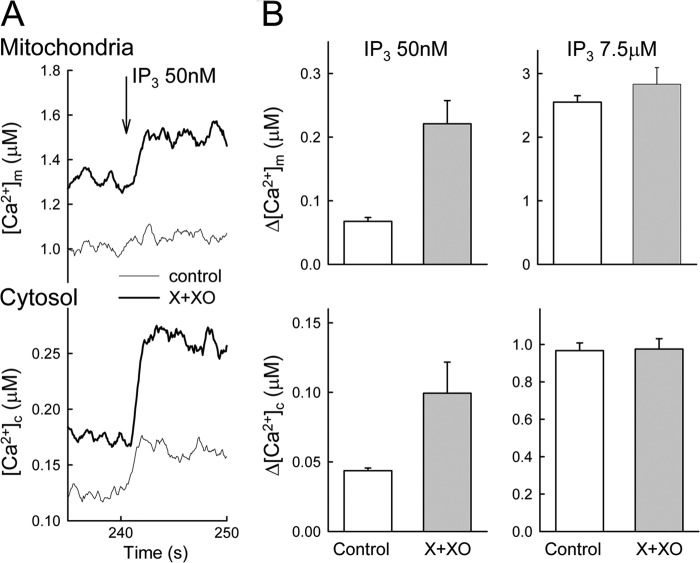
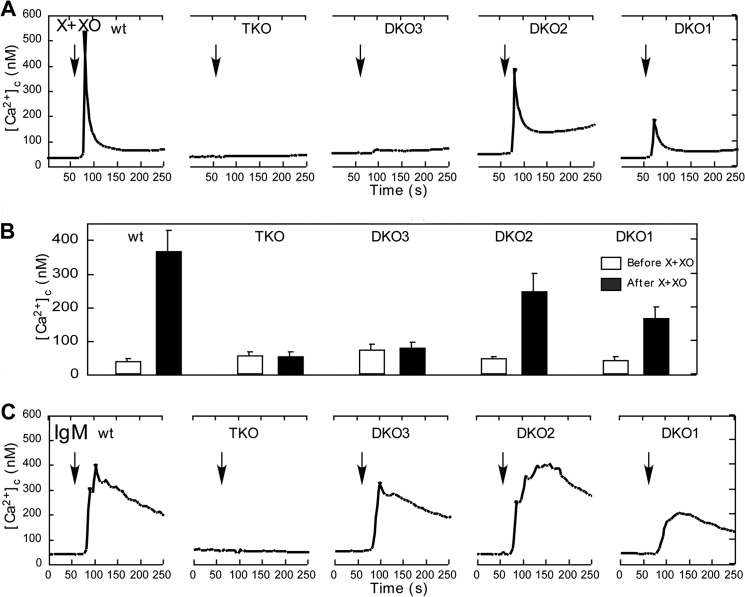
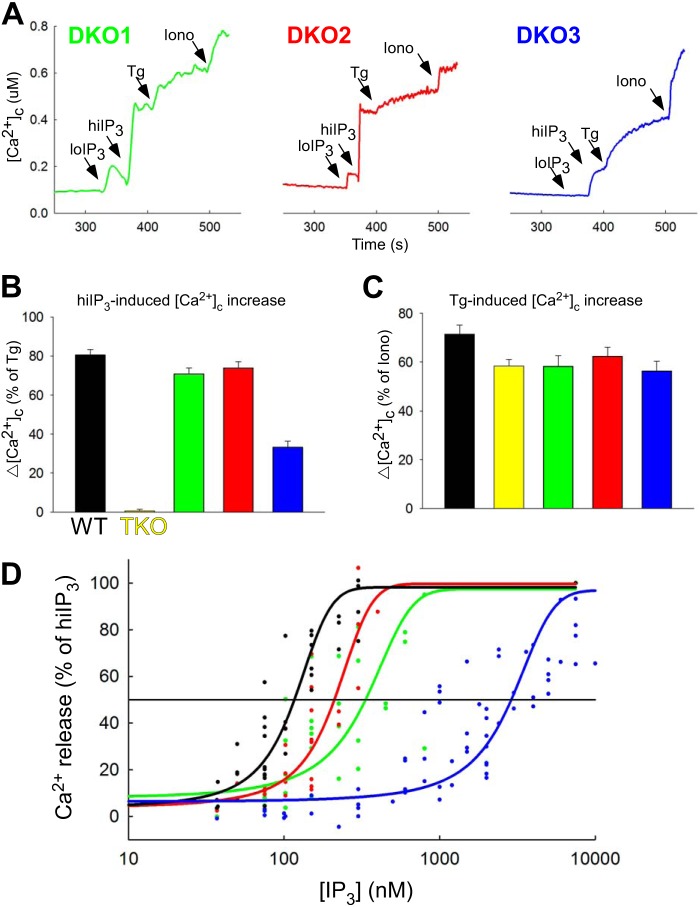
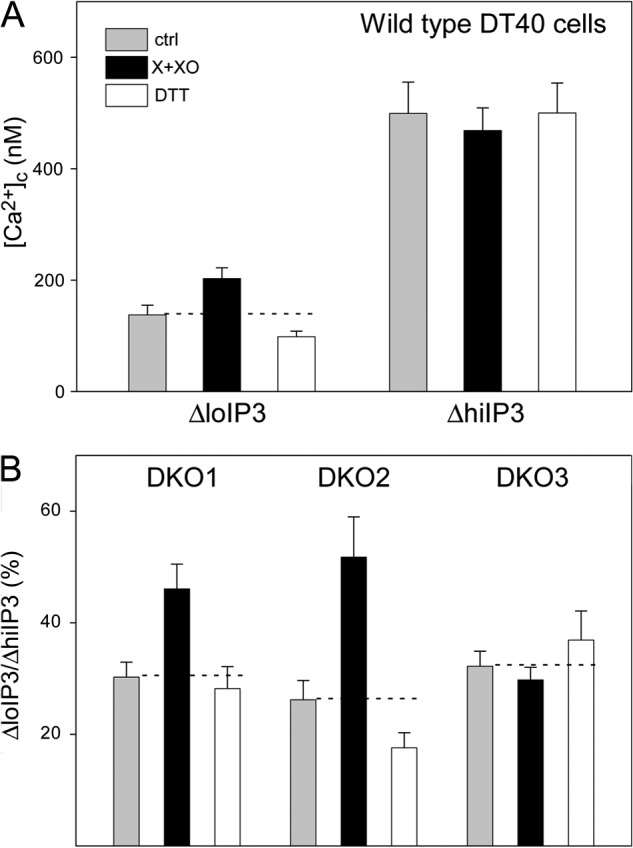
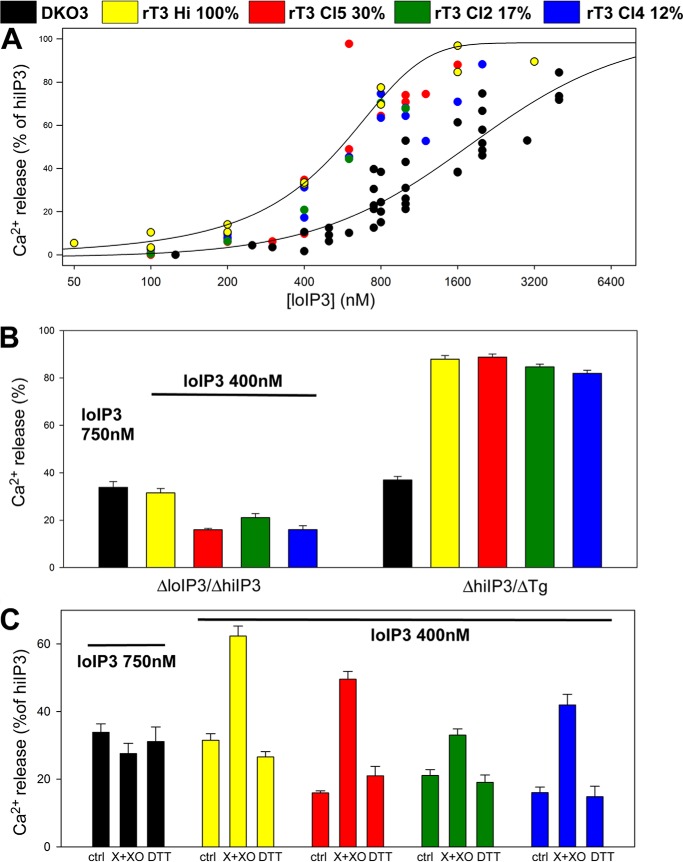
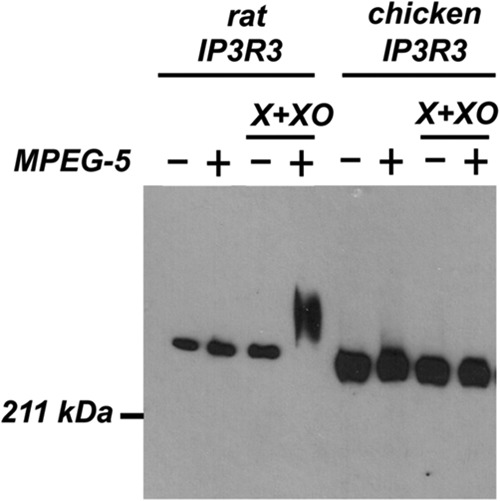
Reactive oxygen species (ROS) stimulate cytoplasmic [Ca(2+)] ([Ca(2+)]c) signaling, but the exact role of the IP3 receptors (IP3R) in this process remains unclear. IP3Rs serve as a potential target of ROS produced by both ER and mitochondrial enzymes, which might locally expose IP3Rs at the ER-mitochondrial associations. Also, IP3Rs contain multiple reactive thiols, common molecular targets of ROS. Therefore, we have examined the effect of superoxide anion (O2) on IP3R-mediated Ca(2+) signaling. In human HepG2, rat RBL-2H3, and chicken DT40 cells, we observed [Ca(2+)]c spikes and frequency-modulated oscillations evoked by a O2 donor, xanthine (X) + xanthine oxidase (XO), dose-dependently. The [Ca(2+)]c signal was mediated by ER Ca(2+) mobilization. X+XO added to permeabilized cells promoted the [Ca(2+)]c rise evoked by submaximal doses of IP3, indicating that O2 directly sensitizes IP3R-mediated Ca(2+) release. In response to X+XO, DT40 cells lacking two of three IP3R isoforms (DKO) expressing either type 1 (DKO1) or type 2 IP3Rs (DKO2) showed a [Ca(2+)]c signal, whereas DKO expressing type 3 IP3R (DKO3) did not. By contrast, IgM that stimulates IP3 formation, elicited a [Ca(2+)]c signal in every DKO. X+XO also facilitated the Ca(2+) release evoked by submaximal IP3 in permeabilized DKO1 and DKO2 but was ineffective in DKO3 or in DT40 lacking every IP3R (TKO). However, X+XO could also facilitate the effect of suboptimal IP3 in TKO transfected with rat IP3R3. Although in silico studies failed to identify a thiol missing in the chicken IP3R3, an X+XO-induced redox change was documented only in the rat IP3R3. Thus, ROS seem to specifically sensitize IP3Rs through a thiol group(s) within the IP3R, which is probably inaccessible in the chicken IP3R3.

Keywords: Calcium Signaling; Endoplasmic Reticulum (ER); IP3 Receptor; Inositol 1,4,5-Trisphosphate; Mitochondria; Reactive Oxygen Species (ROS).


Figures

FIGURE 1.
FIGURE 1.
Generation of O2 causes dose-dependent [Ca2+]c oscillations in HepG2 cells. A, [Ca2+]c was measured in fura2/AM-loaded intact HepG2 cells treated with 100 μm X + 20 milliunits (mU)/ml XO to produce O2. In the images recorded before (40 s) and after X+XO addition (70 s), the green to red shift (F340 nm/F380 nm increase) indicates a [Ca2+]c elevation in most cells. For the cells, marked by the numbers on them the time course shows that [Ca2+]c spikes and baseline spike oscillations were elicited by X+XO (graphs). B, individual and mean cell [Ca2+]c time course records obtained during exposure to different doses of XO (20, 5, and 1 milliunits/ml). Mean was calculated for all cells (responding and non-responding) in the field. C–E, X+XO dose dependence of the lag time (C), fraction of responding cells (D), and magnitude of the [Ca2+]c rise (E). Data in E also show that heat-inactivated XO (10-min incubation in boiling water) fails to cause a [Ca2+]c rise.
FIGURE 2.
FIGURE 2.
Extracellular generation of O2 causes a rapid and dynamic response in the cytoplasmic redox state. A, [Ca2+]c and glutathione redox state were measured simultaneously in RCaMP and Grx1-roGFP2-expressing intact HepG2 cells treated with 100 μm X + 20 milliunits/ml XO to produce O2. The time course shows the [Ca2+]c spikes recorded in the individual cells of the imaging field (red) and the mean response in the GSH redox state (black). The mean response faithfully represents the kinetic of the single cell responses that were averaged because of the relatively low signal to noise ratio. B, single cell Grx1-roGFP2 ratios obtained at 1 min of stimulation were normalized to the prestimulation ratio values (90 s before stimulation), and the mean was calculated for cells treated with X+XO and with X alone, respectively (nine measurements for each, ∼10 cells/measurement). A significant increase was obtained for X+XO as compared with X alone (p < 0.03). Please note that a continuous downward baseline drift caused lowering R160s/R10s under 1 in 150 s.
FIGURE 3.
FIGURE 3.
The O2-induced [Ca2+]c signal requires ER Ca2+-mobilization but is not dependent on Ca2+ entry or mitochondrial Ca2+ storage. A–D, mean [Ca2+]c time course is shown for all cells (10–20 cells) in the imaging field. A, X+XO 20 milliunits/ml-induced [Ca2+]c rise. B, ER Ca2+ store predepletion with thapsigargin (Tg; 2 μm) treatment prevented the O2-induced [Ca2+]c rise. C, uncoupling of the mitochondria by 5 μm FCCP + 5 μg/ml oligomycin (Oligo) pretreatment did not interfere with the O2-induced [Ca2+]c rise. D, incubation of the cells in a nominally Ca2+-free medium did not prevent the O2-induced [Ca2+]c rise. E, bar charts show the summary of the individual cell records shown in A–D (n = 50–100 cells).
FIGURE 4.
FIGURE 4.
O2 evokes a [Ca2+]c signal in a variety of cell types. X+XO (20 milliunits/ml)-induced [Ca2+]c signal in intact RBL-2H3 (A) and DT40 (B) cells loaded with fura2/AM. The upper graphs show the mean [Ca2+]c rise, whereas the other graphs illustrate the heterogeneity of the individual cell responses. Tg, thapsigargin.
FIGURE 5.
FIGURE 5.
O2 promotes IP3-induced Ca2+ mobilization and mitochondrial Ca2+ transfer in permeabilized cells. [Ca2+]m and [Ca2+]c were measured simultaneously in suspensions of permeabilized RBL-2H3 cells, which were either untreated (control) or pretreated with X+XO. Responses were measured by furaFF/AM compartmentalized in the mitochondria (upper graphs) and by rhod2/FA in the cytosol (lower graphs). A, time courses of responses to suboptimal IP3 (50 nm). B, amplitudes of mean responses to suboptimal IP3 (50 nm) and maximal IP3 (7.5 μm) (n = 4–5).
FIGURE 6.
FIGURE 6.
IP3R isoform dependent O2-induced [Ca2+]c signal in intact DT40 cells. A, time course of the X+XO (20 milliunits/ml)-induced [Ca2+]c signal is shown in wild type (WT), IP3R TKO and DKO individual DT40 cells. The O2-induced [Ca2+]c signal was absent in TKO cells. Similarly, IP3R3 expressing DT40 cells (DKO3) also failed to respond to O2, whereas only IP3R1 (DKO1) and IP3R2 (DKO2) expressing cells showed a [Ca2+]c signal. B, summary of the peak [Ca2+]c increases obtained in the five different cell types. C, time course of the [Ca2+]c signal evoked by IgM (2 μg/ml), a phospholipase C-coupled agonist in each DT40 cell type. Every DKO cell type expressing at least one IP3R isoform, even IP3R3, showed an IgM-induced [Ca2+]c signal.
FIGURE 7.
FIGURE 7.
IP3 sensitivity of the ER Ca2+ storage pools in DT40 cells expressing various IP3R isoforms. IP3-induced Ca2+ mobilization was measured in suspensions of permeabilized DT40 cells. A, [Ca2+]c increases evoked by sequential additions of suboptimal (100 nm), maximal (7.5 μm) concentrations of IP3, thapsigargin (Tg; 2 μm), and ionomycin (Iono, 10 μm) are shown for DKO1, DKO2, and DKO3 cells. B and C, summary of the peak [Ca2+]c increases evoked by IP3 (7.5 μm, B) and thapsigargin (2 μm, C) in wild type, TKO, and DKO cells. D, IP3 dose response for [Ca2+]c increases in wild type cells and various DKO cells (each symbol represents a separate measurement).
FIGURE 8.
FIGURE 8.
O2 sensitizes IP3R1 and IP3R2 to IP3-induced Ca2+ mobilization. IP3-induced Ca2+ mobilization was measured in the presence or absence of X+XO (100 μm and 20 milliunits) or DTT (1 mm), a thiol-protecting agent in suspensions of permeabilized cells using fura2/FA. A, the [Ca2+]c increases evoked by both suboptimal (100 nm) and maximal (7.5 μm) concentrations of IP3 are shown for WT DT40 cells (n = 12). X+XO increased and DTT decreased the response to suboptimal IP3 (p < 0.03) but did not alter significantly the effect of maximal IP3. These results indicate O2-induced sensitization of the IP3Rs. B, [Ca2+]c increases mediated by individual IP3R isoforms were monitored in DKO1 (n = 11), DKO2 (n = 15), and DKO3 (n = 18) cells. Because of the different IP3 sensitivity of IP3R1, IP3R2 and IP3R3, different suboptimal IP3 concentrations were used for each cell type to attain ∼30% [Ca2+]c increase relative to the effect of the maximal IP3. O2 caused sensitization of IP3R1 and IP3R2 (p < 0.01) but failed to affect IP3R3. ctrl, control.
FIGURE 9.
FIGURE 9.
O2 differently sensitizes chicken and rat IP3R3s. The effect of X+XO on [Ca2+]c increase was tested in suspensions of permeabilized DKO3 and in TKO rescued with rat IP3R3 (clones expressing the most IP3R (100%), 30, 17, and 12% are marked by yellow, red, green and blue, respectively). A, IP3 dose response relationships show that TKO cells expressing varying amounts of rat IP3R are more sensitive to IP3 than the chicken IP3R3 expressing DKO3 cells. B, left, cumulative data for DKO3 and TKO cells expressing varying amounts of rat IP3R3. Cells were treated with the amount of IP3 that mobilizes 30% of stored calcium as determined in A: 750 nm IP3 for DKO3 cells and 400 nm for TKO cells. Responses of TKO cells are relative to the response to 7.5 μm IP3. Right, cumulative responses to 7.5 μm IP3 normalized to the total thapsigargin (Tg)-sensitive storage in each cell line. C, X+XO-induced sensitization in rat IP3R3 expressing cells. Rescue clones expressing rat IP3R3 at lower levels showed lesser IP3 sensitivity but were also sensitized by O2. ctrl, control.
FIGURE 10.
FIGURE 10.
O2 induced thiol oxidation is absent in chicken IP3R3 but is present in rat IP3R3. Trichloroacetic acid and a strongly denaturing buffer (SDS/urea) was used to prepare lysates from control and X+XO-treated DT40 cells expressing rat IP3R3 (TKO rescued with rat IP3R3) or chicken IP3R3 (DKO3) as described in “Experimental Procedures.” After initially blocking all free thiol groups with iodoacetamide, the remaining modified thiol residues were reduced with DTT and then reacted with methoxy polyethylene glycol (MPEG-5). The presence of oxidized thiol residues in the receptor is indicated by a gel shift reaction detected by immunoblotting on 5% SDS-PAGE. The data shown indicate that the thiols in the endogenous rat or chicken IP3R3 receptor are almost entirely in the reduced state under control conditions and only the rat isoform shows an oxidation response with X+XO. Because of differences in the expression levels of the chicken and rat isoforms the amount of protein loaded for the two isoforms was different (2 μg of rat; 20 μg of chicken). The data shown are representative of three experiments.

References

    1. Berridge M. J. (2009) Inositol trisphosphate and calcium signalling mechanisms. Biochim. Biophys. Acta 1793, 933–940 - PubMed
    1. Mikoshiba K. (2007) IP3 receptor/Ca2+ channel: from discovery to new signaling concepts. J. Neurochem. 102, 1426–1446 - PubMed
    1. Petersen O. H., Tepikin A. V. (2008) Polarized calcium signaling in exocrine gland cells. Annu. Rev. Physiol. 70, 273–299 - PubMed
    1. Sanderson M. J., Delmotte P., Bai Y., Perez-Zogbhi J. F. (2008) Regulation of airway smooth muscle cell contractility by Ca2+ signaling and sensitivity. Proc. Am. Thorac. Soc. 5, 23–31 - PubMed
    1. Lewis R. S. (2001) Calcium signaling mechanisms in T lymphocytes. Annu. Rev. Immunol. 19, 497–521 - PubMed

Publication types

Substances

LinkOut - more resources