

The immune profile associated with acute allergic asthma accelerates clearance of influenza virus
- PMID: 24469764
- PMCID: PMC4037497
- DOI: 10.1038/icb.2013.113
The immune profile associated with acute allergic asthma accelerates clearance of influenza virus
Abstract
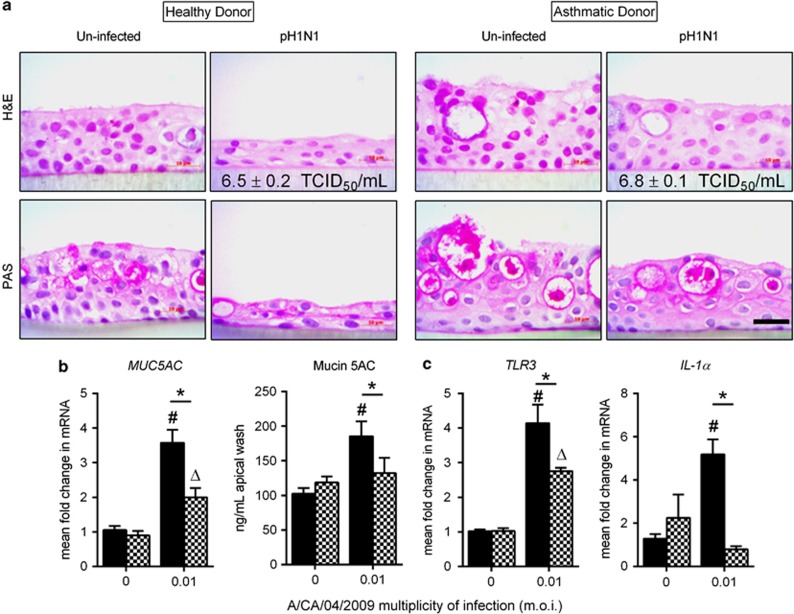
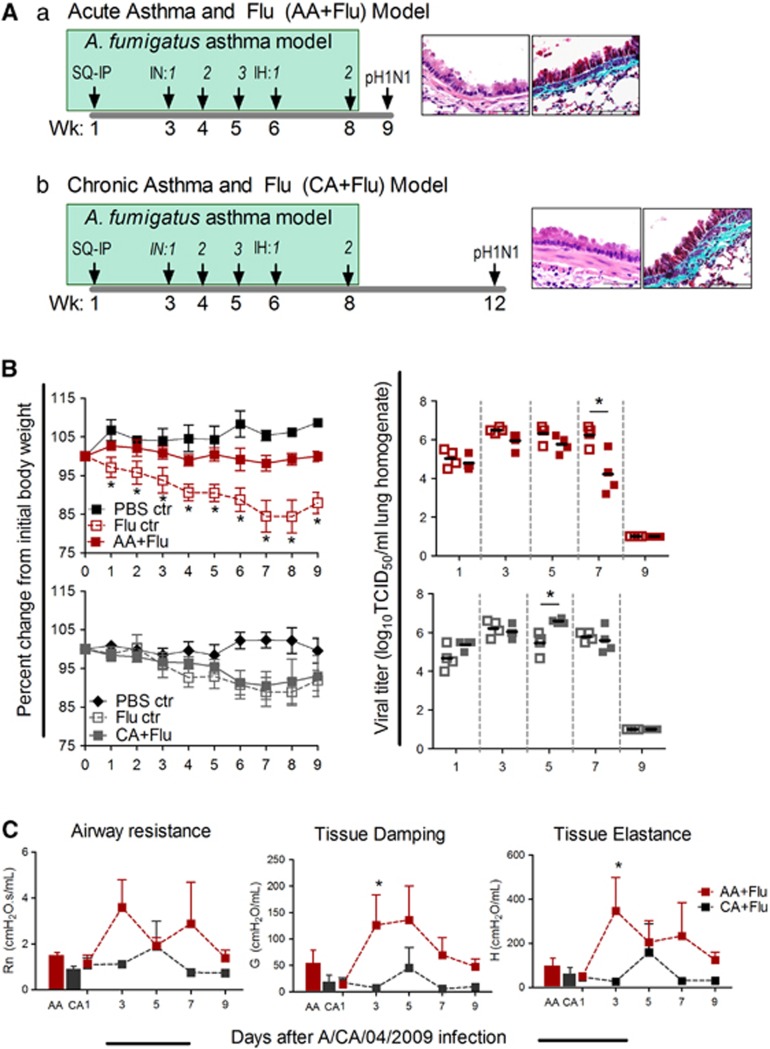
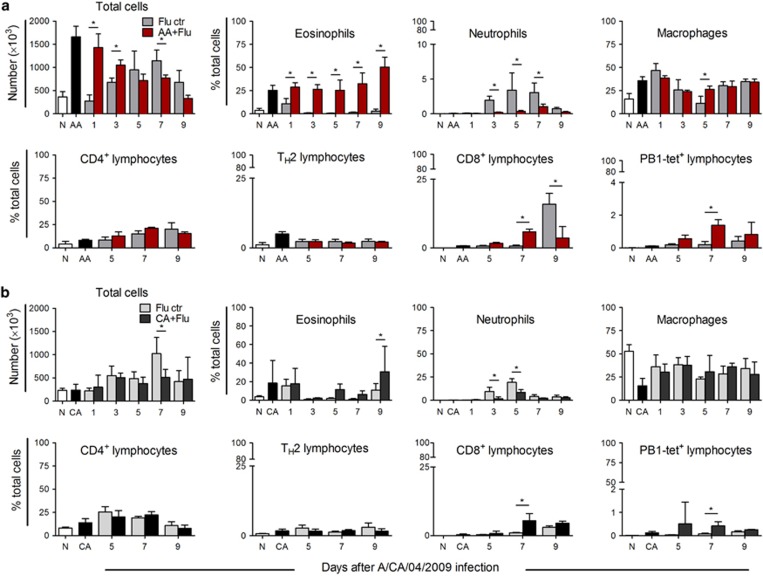
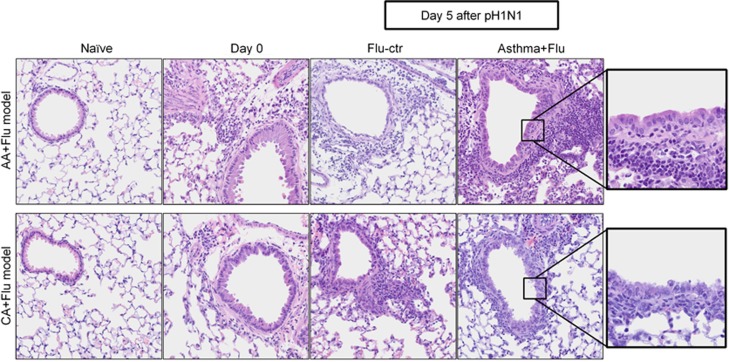
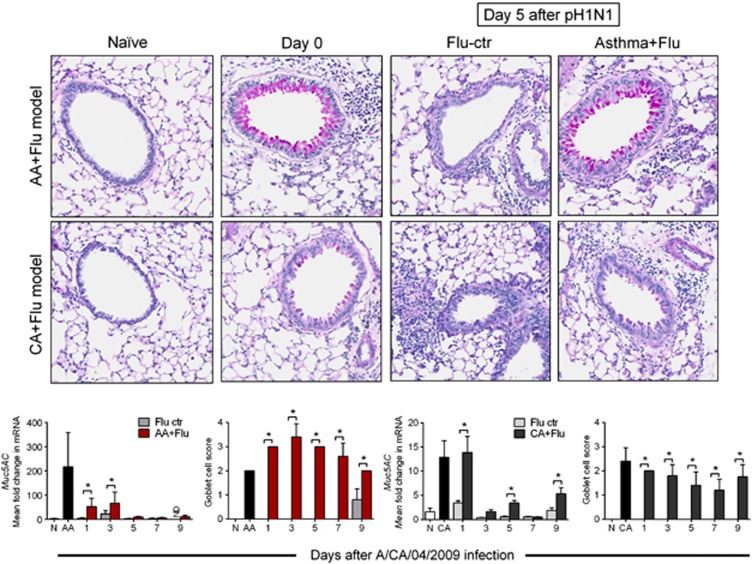
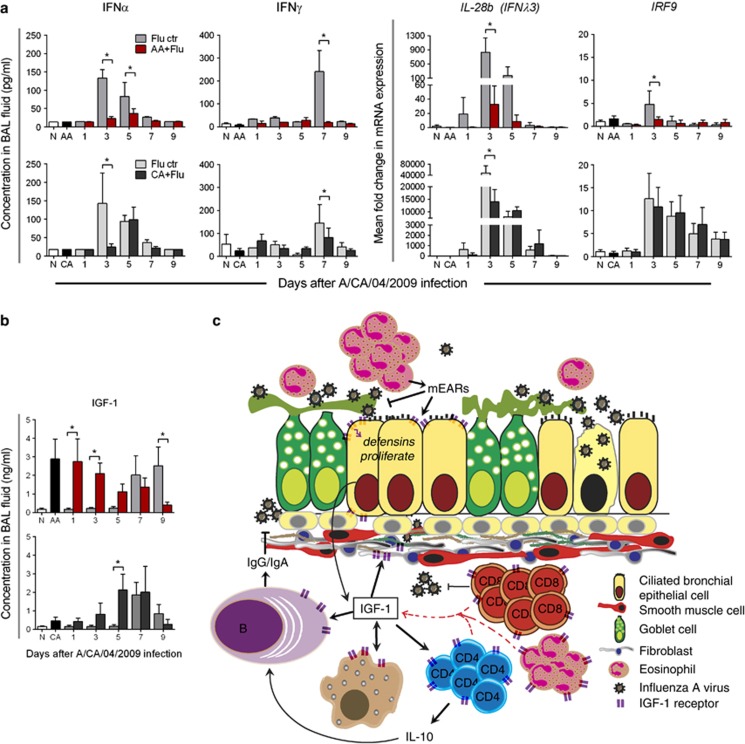
Asthma was the most common comorbidity in hospitalized patients during the 2009 influenza pandemic. For unknown reasons, hospitalized asthmatics had less severe outcomes and were less likely to die from pandemic influenza. Our data with primary human bronchial cells indicate that changes intrinsic to epithelial cells in asthma may protect against cytopathology induced by influenza virus. To further study influenza virus pathogenesis in allergic hosts, we aimed to develop and characterize murine models of asthma and influenza comorbidity to determine structural, physiological and immunological changes induced by influenza in the context of asthma. Aspergillus fumigatus-sensitized and -challenged C57BL/6 mice were infected with pandemic H1N1 influenza virus, either during peak allergic inflammation or during airway remodeling to gain insight into disease pathogenesis. Mice infected with the influenza virus during peak allergic inflammation did not lose body weight and cleared the virus rapidly. These mice exhibited high eosinophilia, preserved airway epithelial cell integrity, increased mucus, reduced interferon response and increased insulin-like growth factor-1. In contrast, weight loss and viral replication kinetics in the mice that were infected during the late airway remodeling phase were equivalent to flu-only controls. These mice had neutrophils in the airways, damaged airway epithelial cells, less mucus production, increased interferons and decreased insulin-like growth factor-1. The state of the allergic airways at the time of influenza virus infection alters host responses against the virus. These murine models of asthma and influenza comorbidity may improve our understanding of the epidemiology and pathogenesis of viral infections in humans with asthma.
Figures
Comment in
-
Asthma and the flu: a tricky two-step.Immunol Cell Biol. 2014 May-Jun;92(5):389-91. doi: 10.1038/icb.2014.24. Epub 2014 Apr 1. Immunol Cell Biol. 2014. PMID: 24687019 Free PMC article. No abstract available.
Similar articles
-
Influenza in Asthmatics: For Better or for Worse?Front Immunol. 2018 Aug 10;9:1843. doi: 10.3389/fimmu.2018.01843. eCollection 2018. Front Immunol. 2018. PMID: 30147697 Free PMC article. Review.
-
Initial Influenza Virus Replication Can Be Limited in Allergic Asthma Through Rapid Induction of Type III Interferons in Respiratory Epithelium.Front Immunol. 2018 May 17;9:986. doi: 10.3389/fimmu.2018.00986. eCollection 2018. Front Immunol. 2018. PMID: 29867963 Free PMC article.
-
Impacts of allergic airway inflammation on lung pathology in a mouse model of influenza A virus infection.PLoS One. 2017 Feb 28;12(2):e0173008. doi: 10.1371/journal.pone.0173008. eCollection 2017. PLoS One. 2017. PMID: 28245238 Free PMC article.
-
Humoral immune responses during asthma and influenza co-morbidity in mice.Immunobiology. 2017 Dec;222(12):1064-1073. doi: 10.1016/j.imbio.2017.08.002. Epub 2017 Sep 7. Immunobiology. 2017. PMID: 28889999 Free PMC article.
-
Innate immune responses to influenza A H5N1: friend or foe?Trends Immunol. 2009 Dec;30(12):574-84. doi: 10.1016/j.it.2009.09.004. Epub 2009 Oct 26. Trends Immunol. 2009. PMID: 19864182 Free PMC article. Review.
Cited by
-
Initiation and Pathogenesis of Severe Asthma with Fungal Sensitization.Cells. 2021 Apr 15;10(4):913. doi: 10.3390/cells10040913. Cells. 2021. PMID: 33921169 Free PMC article. Review.
-
Expression of IL-5 receptor alpha by murine and human lung neutrophils.PLoS One. 2019 Aug 15;14(8):e0221113. doi: 10.1371/journal.pone.0221113. eCollection 2019. PLoS One. 2019. PMID: 31415658 Free PMC article.
-
Sex Hormones Regulate Innate Immune Cells and Promote Sex Differences in Respiratory Virus Infection.Front Immunol. 2018 Jul 20;9:1653. doi: 10.3389/fimmu.2018.01653. eCollection 2018. Front Immunol. 2018. PMID: 30079065 Free PMC article. Review.
-
The Type 2 Asthma Mediator IL-13 Inhibits Severe Acute Respiratory Syndrome Coronavirus 2 Infection of Bronchial Epithelium.Am J Respir Cell Mol Biol. 2022 Apr;66(4):391-401. doi: 10.1165/rcmb.2021-0364OC. Am J Respir Cell Mol Biol. 2022. PMID: 34982656 Free PMC article.
-
Eosinophils Promote Antiviral Immunity in Mice Infected with Influenza A Virus.J Immunol. 2017 Apr 15;198(8):3214-3226. doi: 10.4049/jimmunol.1600787. Epub 2017 Mar 10. J Immunol. 2017. PMID: 28283567 Free PMC article.
References
-
- WHO Asthma. 2011 ASthma Fact Sheet. Available at http://www.who.int/mediacentre/factsheets/fs307/en/index.html (cited 29 July 2013, last accessed on 29 July 2013)..
-
- Fiore AE, Shay DK, Broder K, Iskander JK, Uyeki TM, Mootrey G, et al. Prevention and control of seasonal influenza with vaccines: recommendations of the Advisory Committee on Immunization Practices (ACIP), 2009. MMWR. 2009;58:1–52. - PubMed
-
- Jain S, Kamimoto L, Bramley AM, Schmitz AM, Benoit SR, Louie J, et al. Hospitalized patients with 2009 H1N1 influenza in the United States, April–June 2009. N Engl J Med. 2009;361:1935–1944. - PubMed
Publication types
MeSH terms
Substances
Grants and funding
LinkOut - more resources
Full Text Sources
Other Literature Sources
Medical
