. 2014 Feb 11;111(6):2319-24.
doi: 10.1073/pnas.1324019111. Epub 2014 Jan 27.

Using constellation pharmacology to define comprehensively a somatosensory neuronal subclass

Affiliations

Using constellation pharmacology to define comprehensively a somatosensory neuronal subclass

Russell W Teichert et al. Proc Natl Acad Sci U S A. .

Abstract

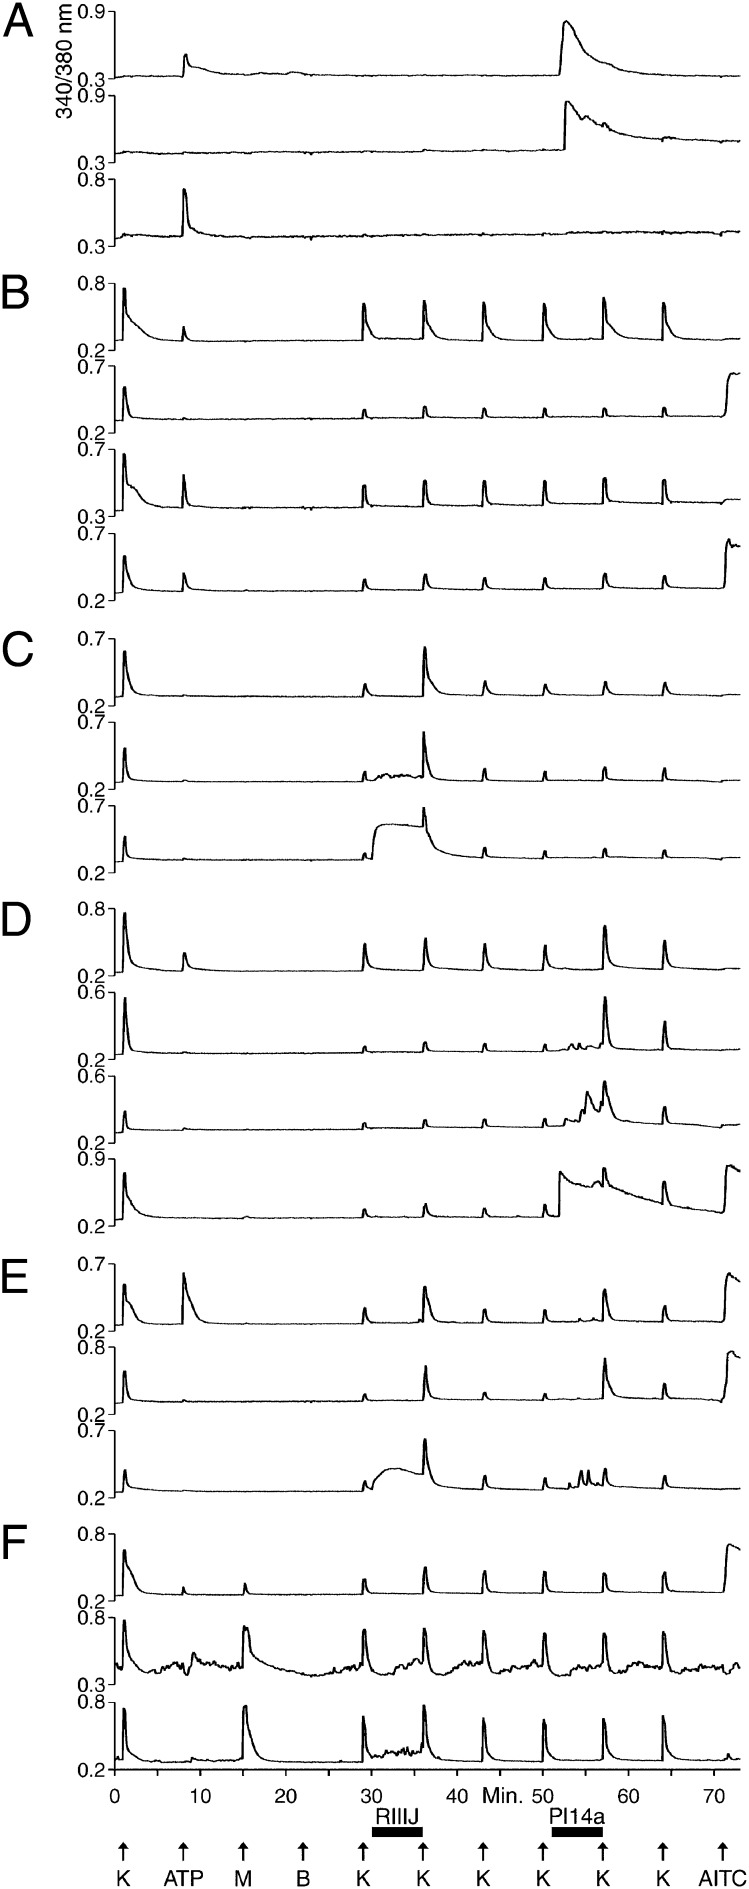
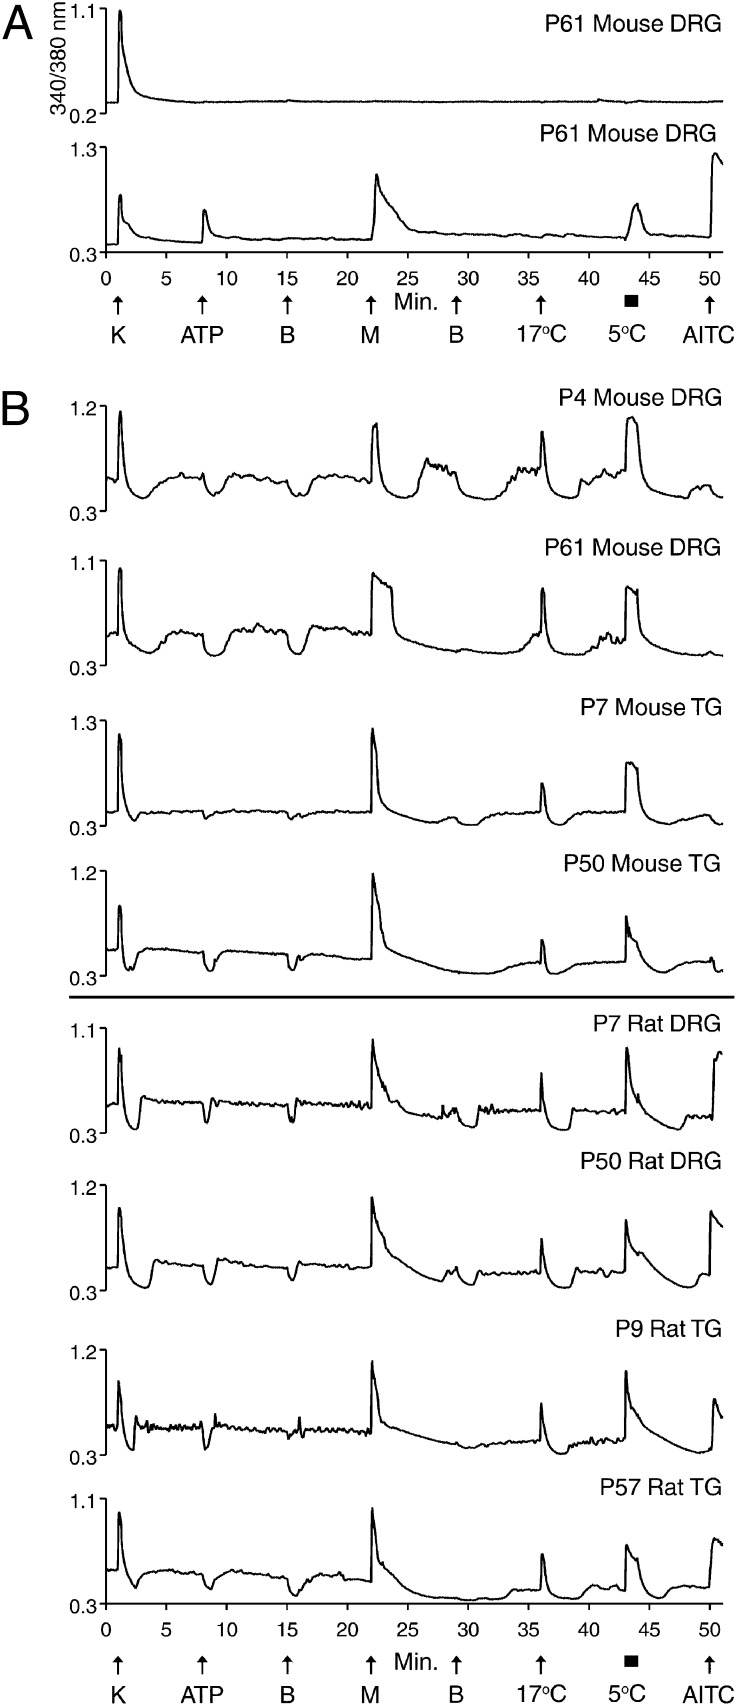
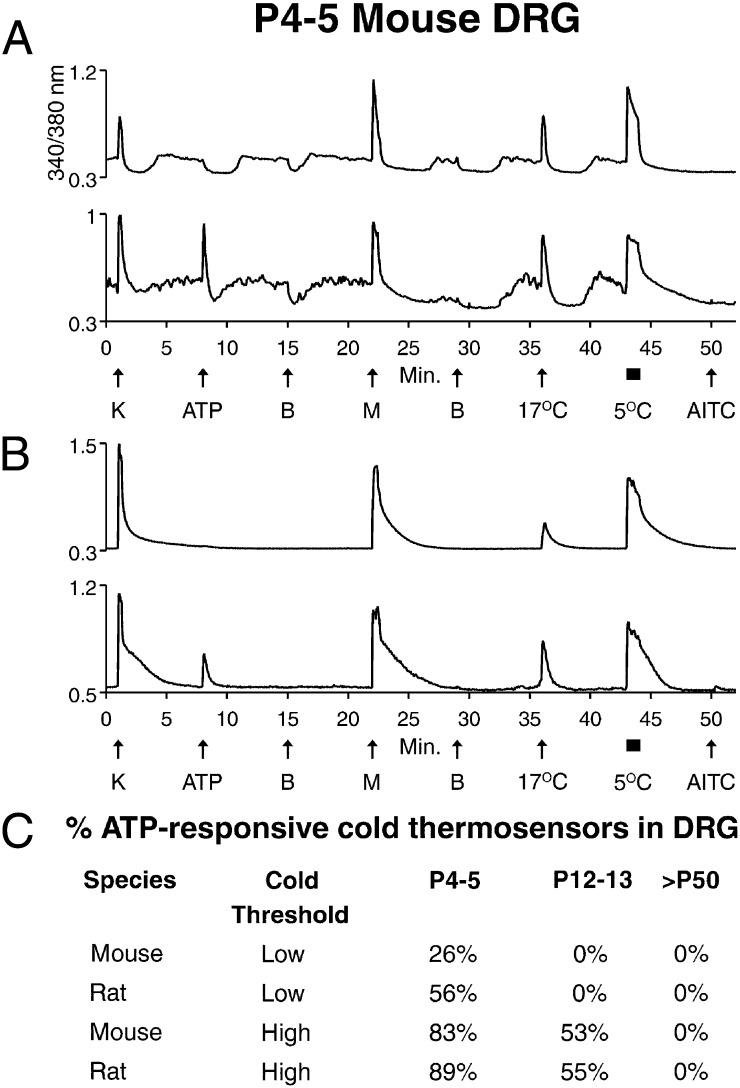
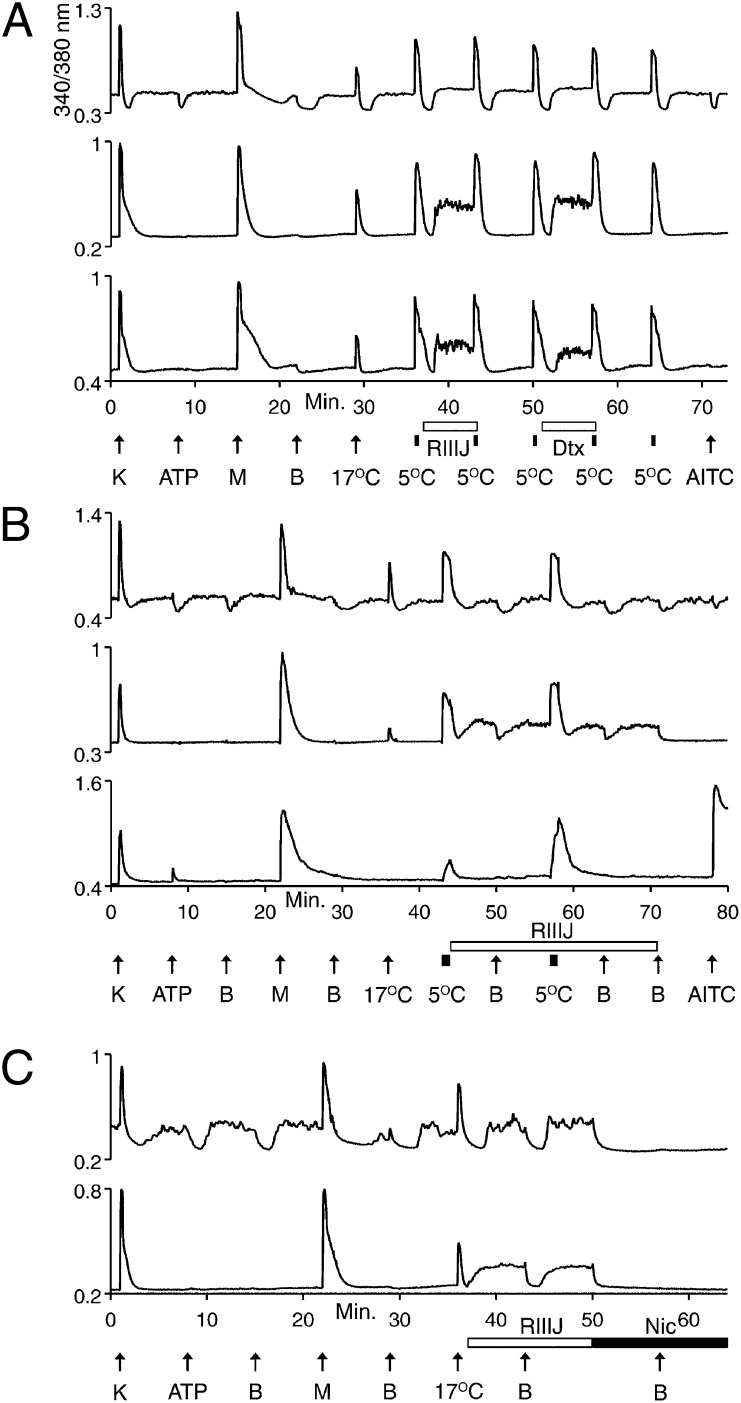
Change is intrinsic to nervous systems; change is required for learning and conditioning and occurs with disease progression, normal development, and aging. To better understand mammalian nervous systems and effectively treat nervous-system disorders, it is essential to track changes in relevant individual neurons. A critical challenge is to identify and characterize the specific cell types involved and the molecular-level changes that occur in each. Using an experimental strategy called constellation pharmacology, we demonstrate that we can define a specific somatosensory neuronal subclass, cold thermosensors, across different species and track changes in these neurons as a function of development. Cold thermosensors are uniformly responsive to menthol and innocuous cool temperature (17 °C), indicating that they express TRPM8 channels. A subset of cold thermosensors expressed α7 nicotinic acetylcholine receptors (nAChRs) but not other nAChR subtypes. Differences in temperature threshold of cold thermosensors correlated with functional expression of voltage-gated K channels Kv1.1/1.2: Relatively higher expression of KV1.1/1.2 channels resulted in a higher threshold response to cold temperature. Other signaling components varied during development and between species. In cold thermosensors of neonatal mice and rats, ATP receptors were functionally expressed, but the expression disappeared with development. This developmental change occurred earlier in low-threshold than high-threshold cold thermosensors. Most rat cold thermosensors expressed TRPA1 channels, whereas mouse cold thermosensors did not. The broad implications of this study are that it is now feasible to track changes in receptor and ion-channel expression in individual neuronal subclasses as a function of development, learning, disease, or aging.

Keywords: DRG; KV1.2; calcium imaging; purinergic receptor; trigeminal.


Conflict of interest statement

The authors declare no conflict of interest.

Figures

Fig. 1.
Fig. 1.
Selected calcium-imaging traces (functional fingerprints) of individual cells from a mouse DRG cell population. See Materials and Methods for a description of the experimental protocol. Each trace is the response of an individual cell from a single experimental trial. At minute 1, K means 30 mM [K+]o; at all other time points, K means 20 mM [K+]o. (A) Traces from three cells that did not respond to depolarization by 30 mM [K+]o, indicating that they are not neurons. Two of the cells responded to application of 20 μM ATP, and two responded transiently to application of a cone-snail venom peptide, Pl14a (16 μM), a selective antagonist of the voltage-gated K channel, KV1.6. These cells did not respond to application of 1 μM κM–conotoxin RIIIJ (RIIIJ), a selective blocker of KV1.2. (B) Traces from neurons that were relatively insensitive to either RIIIJ or Pl14a. Two cells responded to ATP, but not 100 μM AITC. One cell responded to AITC, but not ATP. One cell responded to ATP and AITC. (C) Three neurons that responded to RIIIJ with a direct response and/or amplification of the response elicited by depolarization with 20 mM [K+]o. (D) Four neurons that responded to Pl14a with a direct response and/or amplification of the response elicited by depolarization by 20 mM [K+]o. Notably, one cell responded to ATP, and one cell responded to AITC. (E) Three neurons that responded to both RIIIJ and Pl14a, either with direct responses or with amplifications of the responses elicited by depolarization by 20 mM [K+]o. One cell responded to ATP and AITC. One cell responded to AITC but not ATP. (F) Three neurons that responded to 400 μM menthol.
Fig. 2.
Fig. 2.
Species difference in AITC sensitivity of cold thermosensors. See Materials and Methods for a description of the experimental protocol. (A) (Upper trace) Mouse DRG neuron that only responded to depolarization by 30 mM [K+]o. (Lower trace) Cold-nociceptor that responded to 20 μM ATP, 400 μM menthol, bath solution at 5 °C, and 100 μM AITC, but not bath solution at 17 °C. (B) Cold thermosensors from indicated cultures. Each neuron responded to menthol and bath solution at 17 °C and 5 °C. However, they did not respond to ATP. These neurons exhibited unstable [Ca2+]i baselines, most evident when bath solution was replaced with identical bath solution (or containing ATP), which caused a transient dip in baseline [Ca2+]i. Neurons from mouse DRG and TG did not respond to AITC (top four traces), whereas those from rat DRG and TG did respond to AITC (bottom four traces).
Fig. 3.
Fig. 3.
Developmental difference in ATP sensitivity of cold thermosensors. See Materials and Methods for a description of the experimental protocol. (A and B) Traces from P4–5 mouse DRG neurons. (A) Low-threshold cold thermosensors, including one that responded to 20 μM ATP (lower trace) and one that did not (upper trace). (B) High-threshold cold thermosensors, including one that responded to ATP (lower trace) and one that did not (upper trace). (C) A summary of the percentage of ATP-responsive DRG neurons from low- and high-threshold cold thermosensors (exemplified in A and B) is shown for three different ages of mouse and rat. For each type of cell preparation (rat or mouse at each age), ≥26 cumulative cold thermosensors were examined in five or more independent experimental trials.
Fig. 4.
Fig. 4.
Cell-type differences in response to K-channel block. See Materials and Methods for a description of the experimental protocol. Traces from P11–15 mouse TG neurons. (A) (Top trace) Low-threshold cold thermosensor unaffected by 1 μM RIIIJ or 200 nM α-Dtx. (Middle and bottom traces) High-threshold cold thermosensors responded to 1 μM RIIIJ, 200 nM α-Dtx (middle trace), or 200 nM Dtx-K (bottom trace) with increases in [Ca2+]i. (B) (Top trace) Low-threshold cold thermosensor unaffected by 1 μM RIIIJ. (Middle trace) Cellular phenotype of high-threshold cold thermosensor changed to low-threshold cold thermosensor by RIIIJ. (Bottom trace) [Ca2+]i baseline of high-threshold cold-nociceptor was unaltered, but its response to 5 °C was amplified by RIIIJ. (C) (Top trace) Low-threshold cold thermosensor unaffected by RIIIJ, but its [Ca2+]i baseline was blocked to the lowest level observed during [Ca2+]i dips by 10 μM nicardipine (Nic), and the [Ca2+]i baseline did not dip in presence of nicardipine upon exchange of bath solution. (Bottom trace) Phenotype of a high-threshold cold thermosensor changed by RIIIJ to that of a low-threshold cold thermosensor.
Fig. 5.
Fig. 5.
Cell-type similarity in α7 nAChR responses among a subset of cold thermosensors. See Materials and Methods for a description of the experimental protocol. (A) (Top trace) Neuron that responded to depolarization by 30 mM [K+]o, 20 μM ATP, 1 mM ACh, and 100 μM AITC with transient increases in [Ca2+]i. This neuron responded to 1 mM ACh before application of 10 μM PNU. Such neurons served as controls. (Bottom two traces) Low-threshold cold thermosensors responded to ACh only after preincubation with PNU, suggesting that they express α7 nAChRs. The middle trace is from mouse TG, and the bottom trace is from rat DRG. (B) The PNU-enhanced, ACh-induced responses were blocked by the selective antagonist of α7 nAChRs, α-conotoxin ArIB[V11L;V16D]. The filled horizontal bar indicates when 10 μM PNU was present, and the open horizontal bar indicates when 200 nM α-conotoxin ArIB[V11L;V16D] was present. No response to 1 mM ACh was observed before PNU application. After preincubation with PNU, this neuron responded to applications of ACh. The responses were blocked reversibly by α-conotoxin ArIB[V11L;V16D].

Comment in

References

    1. Teichert RW, et al. Characterization of two neuronal subclasses through constellation pharmacology. Proc Natl Acad Sci USA. 2012;109(31):12758–12763. - PMC - PubMed
    1. Cardin JA, et al. Targeted optogenetic stimulation and recording of neurons in vivo using cell-type-specific expression of Channelrhodopsin-2. Nat Protoc. 2010;5(2):247–254. - PMC - PubMed
    1. Packer AM, Roska B, Häusser M. Targeting neurons and photons for optogenetics. Nat Neurosci. 2013;16(7):805–815. - PMC - PubMed
    1. Reiner A, Isacoff EY. The Brain Prize 2013: The optogenetics revolution. Trends Neurosci. 2013;36(10):557–560. - PubMed
    1. Smedemark-Margulies N, Trapani JG. Tools, methods, and applications for optophysiology in neuroscience. Front Mol Neurosci. 2013;6:18. - PMC - PubMed

Publication types