. 2014 Feb 11;111(6):E645-54.
doi: 10.1073/pnas.1312523111. Epub 2014 Jan 27.

Identifying and mapping cell-type-specific chromatin programming of gene expression

Affiliations

Identifying and mapping cell-type-specific chromatin programming of gene expression

Troels T Marstrand et al. Proc Natl Acad Sci U S A. .

Abstract

A problem of substantial interest is to systematically map variation in chromatin structure to gene-expression regulation across conditions, environments, or differentiated cell types. We developed and applied a quantitative framework for determining the existence, strength, and type of relationship between high-resolution chromatin structure in terms of DNaseI hypersensitivity and genome-wide gene-expression levels in 20 diverse human cell types. We show that ∼25% of genes show cell-type-specific expression explained by alterations in chromatin structure. We find that distal regions of chromatin structure (e.g., ±200 kb) capture more genes with this relationship than local regions (e.g., ±2.5 kb), yet the local regions show a more pronounced effect. By exploiting variation across cell types, we were capable of pinpointing the most likely hypersensitive sites related to cell-type-specific expression, which we show have a range of contextual uses. This quantitative framework is likely applicable to other settings aimed at relating continuous genomic measurements to gene-expression variation.

Keywords: association; computational biology; encode; epigenetics; gene regulation.


Conflict of interest statement

The authors declare no conflict of interest.

Figures
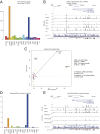
Fig. 1.
Fig. 1.
Overview of data and proposed approach. (A) Gene-expression measurements for 20 cell lines on an example gene, HNF4A. (B) DHS fragment sequencing counts in a region about the gene. (C) The DHS signal is captured by summing the overall number of fragments over a given segment size (e.g., ±100 kb) about the gene’s TSS to obtain a DHS volume. After global normalization, the gene-expression data and DHS volume measures are scaled to lie on the unit interval [0,1] and the data are centered about the origin according to the 2D medoid. For the HNF4A example, three outliers are clearly visible; for example, HepG2 displays both chromatin accessibility and active gene expression, whereas HeLa displays only chromatin accessibility. The goal is to quantitatively capture the isolated relationship seen in HepG2 and assess whether this relationship is statistically significant. Traditional measures of linear correlation are not suitable for identifying this type of signal, as shown by the substantial change seen after removal of a single cell line, HeLa, even though the data for HeLa are expected to exist for many genes and cell lines. The proposed ARS is robust to HeLa because the measure is based on angular placement and the median distance to the medoid of the data (dashed circle). (D) The ARS is calculating by first quantifying the relative distance to the origin for each cell line in a robust manner. An angular penalty for each cell line is then calculated to quantify cell types concordant in both expression and DHS measured. This quantity is measured in terms of angular distance from the 45° line, and it is then multiplied times its respective relative distance to give and overall score for each cell line. The maximum score is taken as the statistic for the given gene, allowing a comparison across all genes. (E) A local version of the ARS we introduce can pinpoint DHS “peaks” contributing the most to the detected association. See main text for details on the proposed methods.
Fig. 2.
Fig. 2.
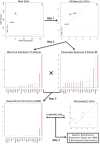
Overview of ARS method, applied to example gene CD69. (Step 1) For a given gene, DHS volume and gene expression are calculated for all 20 cell lines as described in the text. DHS volume and gene expression are respectively scaled to lie on the unit interval [0,1] and then median centered before considering their joint distribution. Each cell type corresponds to a single point. (Step 2) To form the “ratio” component of the ARS, ri, the distance from the origin to each point is calculated and then scaled by the median distance (Left). The angular distance between each point and the identity line is calculated and evaluated in an exponential function to determine an angular penalty ai for each cell type (Right). (Step 3) The final ARS is computed as the product of the normalized distances and the angular penalties, formula image. The maximal statistic formula image is calculated for each gene and the corresponding cell type recorded, in this case the TH1 cell line. (Step 4) A randomization method is performed to generate null data, upon which null formula image are calculated. These are compared with the observed formula image values to calculate the statistical significance of each gene.
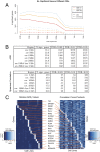
Fig. 3.
Fig. 3.
Statistical significance for ARS and correlation across genomic segments. (A) Depicts the number of significant genes found at increasingly larger genomic segments for ARS and Spearman correlation, respectively (solid line is ARS and dashed line is Spearman correlation). (B) Statistical significance according to DHS volume segment size. Column 2 shows the percentage of genes estimated to have concordant DHS volume and gene-expression variation as captured by formula image (formula image, as estimated in ref. 13). Columns 3–5 show the number of statistically significant genes at various FDR cutoffs. Although the 2.5-kb window shows more significant genes at the stringent FDR cutoffs, indicating a larger effect size, the overall percentage of genes showing a relationship is notably lower than the more distal DHS volumes. Compared with Spearman correlation, ARS is more powerful at detecting these associations (see SI Appendix for further details). (C) The relative ARSi values across all cell types for significant genes in the ±100 kb region versus the analogous components for Spearman correlation (the cross-product terms that sum to form the overall correlation). The ARSi values distinguish cell lines that have a strong DHS and expression concordance substantially more clearly than the Spearman correlation, showing that the traditional correlation is more likely to generate spurious results from small changes to the data. Enrichment of biological functions for the significant genes found by either method corroborates this finding (SI Appendix, Fig. S13).
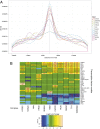
Fig. 4.
Fig. 4.
Analysis of local ARS profiles. (A) Distribution of local ARS peaks relative to the TSS according to cell type. The positional bias of cell-type-specific local ARS peaks as measured by the density of local ARS peaks within cell lines with respect to position from to the TSS. Clear differences in the amount of distal regulation are seen across the cell types and the density around the TSS differ markedly among cell types. For example, HL60 shows a more proximal signal relative to that of HAEpiC. (B) Transcription-factor binding site analysis among local ARS peaks occurring 10 to 200 kb from the TSS. Sequences corresponding to local ARS peaks within significant cell-type-specific genes were searched with known transcription-factor binding site models, and the relative over- and underrepresentation was assessed based on a negative control set. Instances of absolute log2 fold-change ≥2 are displayed within the relevant cell types. Overrepresentation is indicative of a preferential transcription factor binding site, and is therefore a likely regulatory candidate for the observed gene expression. Underrepresented sites indicate factors that should be avoided to maintain proper cell-type-specific expression profiles. For instance, Sox2 and Pou5f1 (Oct4) were observed solely overrepresented in the embryonic cells, H7ESC.
Fig. 5.
Fig. 5.
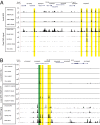
Mapping putative regulatory DHS with local ARS profiles at two loci. (A) The β-globin locus control region. The DHS data for five cell lines (out of 20) are shown, as well as the local ARS profiles for HBB and HBE1 in the K562 and HL60 cell lines. The transparent yellow boxes indicate regulatory regions, specifically hypersensitive regions 1–5 (HS1–5), together with a less characterized site upstream of HBD. It can be seen that HBB and HBE1 show different local ARS profiles, indicative of differences in use of regulatory elements. The local ARS profile shows no peak in HL60 despite the existence of a hypersensitive site when considering DNaseI profile alone. The full data and local ARS profiles for all 20 cell lines and both genes are displayed in SI Appendix, Figs. S25–S29. (B) TAL1 locus. We identified TAL1 as statistically significant with its maximal ARS in the K562 cell line across all tested genomic segments. Local ARS profiles show a dominant effect from the +40 enhancer region (green box), spanning PDZK1IP1. DHS signals across multiple cell types were correctly not detected to be associated with the expression of TAL1. Furthermore, note that even though the DHS data for TAL1 and PDZK1IP1 are largely overlapping, they nevertheless have distinct local ARS profiles due to their different patterns of gene expression. This demonstrates that ARS is capable of separating interwoven signals across cell types for neighboring genes, and that there is information to be gained by combining DHS and gene-expression profiling. The full data for all 20 cell lines and local ARS profiles are displayed in SI Appendix, Figs. S31–S33.

References

    1. Xi H, et al. Identification and characterization of cell type-specific and ubiquitous chromatin regulatory structures in the human genome. PLoS Genet. 2007;3(8):e136. - PMC - PubMed
    1. Boyle AP, et al. High-resolution mapping and characterization of open chromatin across the genome. Cell. 2008;132(2):311–322. - PMC - PubMed
    1. Song F, et al. Association of tissue-specific differentially methylated regions (TDMs) with differential gene expression. Proc Natl Acad Sci USA. 2005;102(9):3336–3341. - PMC - PubMed
    1. Satterlee JS, Schübeler D, Ng HH. Tackling the epigenome: Challenges and opportunities for collaboration. Nat Biotechnol. 2010;28(10):1039–1044. - PubMed
    1. Bernstein BE, et al. ENCODE Project Consortium An integrated encyclopedia of DNA elements in the human genome. Nature. 2012;489(7414):57–74. - PMC - PubMed

Publication types

MeSH terms

LinkOut - more resources