. 2014 Feb 11;111(6):2241-6.
doi: 10.1073/pnas.1315606111. Epub 2014 Jan 27.

CD28 and CD3 have complementary roles in T-cell traction forces

Affiliations

CD28 and CD3 have complementary roles in T-cell traction forces

Keenan T Bashour et al. Proc Natl Acad Sci U S A. .

Abstract

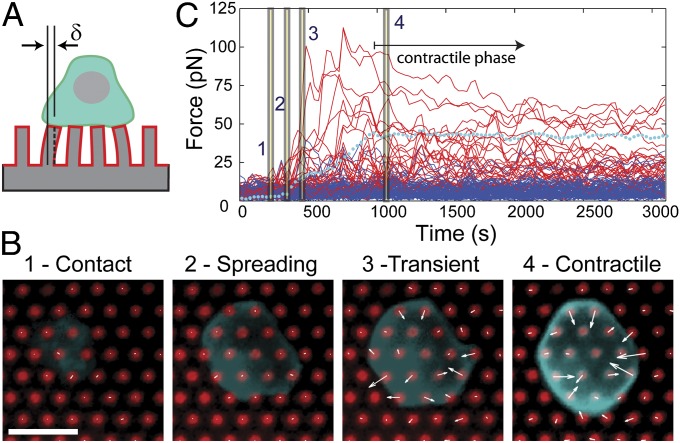
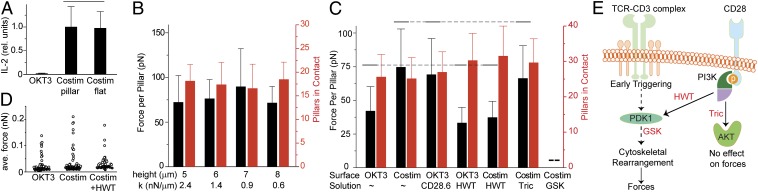
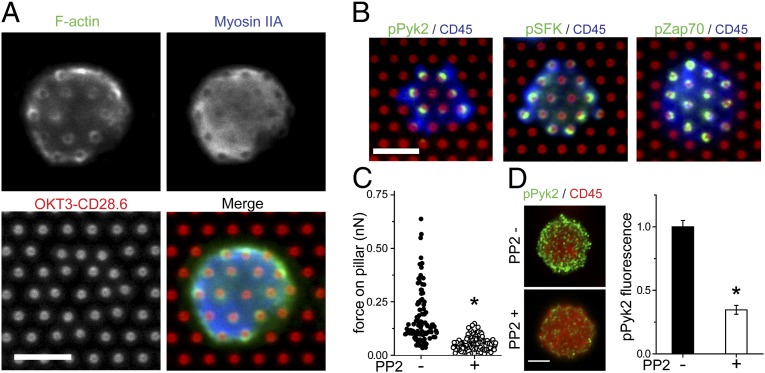
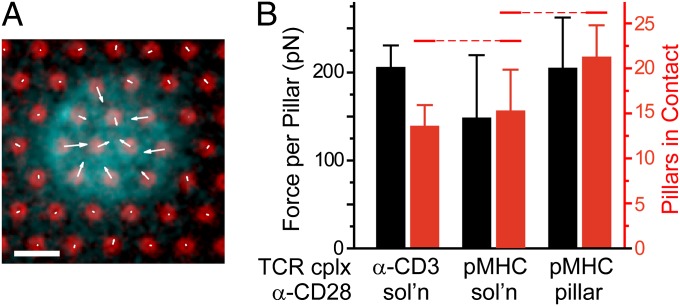
Mechanical forces have key roles in regulating activation of T cells and coordination of the adaptive immune response. A recent example is the ability of T cells to sense the rigidity of an underlying substrate through the T-cell receptor (TCR) coreceptor CD3 and CD28, a costimulation signal essential for cell activation. In this report, we show that these two receptor systems provide complementary functions in regulating the cellular forces needed to test the mechanical properties of the extracellular environment. Traction force microscopy was carried out on primary human cells interacting with micrometer-scale elastomer pillar arrays presenting activation antibodies to CD3 and/or CD28. T cells generated traction forces of 100 pN on arrays with both antibodies. By providing one antibody or the other in solution instead of on the pillars, we show that force generation is associated with CD3 and the TCR complex. Engagement of CD28 increases traction forces associated with CD3 through the signaling pathway involving PI3K, rather than providing additional coupling between the cell and surface. Force generation is concentrated to the cell periphery and associated with molecular complexes containing phosphorylated Pyk2, suggesting that T cells use processes that share features with integrin signaling in force generation. Finally, the ability of T cells to apply forces through the TCR itself, rather than the CD3 coreceptor, was tested. Mouse cells expressing the 5C.C7 TCR exerted traction forces on pillars presenting peptide-loaded MHCs that were similar to those with α-CD3, suggesting that forces are applied to antigen-presenting cells during activation.


Conflict of interest statement

The authors declare no conflict of interest.

Figures

Fig. 1.
Fig. 1.
Contractile forces on pillar arrays. (A) T-cell traction forces were measured using elastomer pillar arrays. (B) T cells (cyan) interacting with pillar arrays coated with OKT3 + CD28.6 (red) show four distinct phases: 1) initial contact; 2) rapid spreading; 3) transient, uncoordinated force generation; and 4) stable contraction. The contractile phase typically begins within 20 min of seeding and lasts the duration of imaging, 1 h. Scale bar: 5 µm and 250 pN (forces are indicated as arrows). This scaling between distance and force is for presentation only and does not indicate the actual pillar displacement. Additional cells are included in Movies S1–S3. (C) Representative plot of the magnitude of force applied to individual pillars as a function of time. Red traces indicate forces on individual pillars under the cell, whereas the blue traces represent pillars away from the interface. The dotted cyan line indicates the average pillar force within the cell–array interface. Time points corresponding to the images in B are indicated by numbers 1–4.
Fig. 2.
Fig. 2.
Traction forces are insensitive to pillar height but respond to CD28 costimulation. (A) Engagement of CD28 augments CD3 signaling, providing functional activation of T cells as measured by 6-h secretion of IL-2. Costim: OKT3 + CD28.6. Data are mean ± SD from three independent experiments; each experiment is represented by the average staining for IL-2 collected over more than 300 cells per condition. Overbars group conditions that were not significantly different, as analyzed using ANOVA and Tukey multiple comparison methods, α = 0.05. (B) The average force and number of pillars contacting a cell on arrays coated with OKT3 + CD28.6 was independent of spring constant. Data are mean ± SD, representing 7–13 cells for each height from three independent experiments, and were analyzed by ANOVA, α = 0.05; overbars are omitted, as no difference was observed. (C) Delineation of pathways through which CD28 augments cellular forces. Data are mean ± SD, from 18–43 cells for each condition over three independent experiments. Solid overbars connected by dotted lines group conditions that were not statistically different, α = 0.05. Overbars are omitted for data of pillars engaged by cells, as no difference was observed between conditions. (D) Average traction force per pillar during the contractile phase from a representative cell for each condition. ●, Pillars away from the cell; ○, pillars underlying the cell. (E) Schematic of force augmentation by CD28 signaling. Inhibitors are indicated in red.
Fig. 3.
Fig. 3.
Local assembly of proteins regulates traction forces. (A) F-actin (green in merged image) and myosin IIA (blue) are present throughout the T-cell–array interface but concentrated in the cell periphery. Pillars were coated with OKT3 + CD28.6 (red). Cells were fixed 30 min after seeding. Scale bar: 5 µm. (B) Phosphospecific staining showed localization of pPyk2 (green, Left) and pSFK (green, Center) to the periphery of the cell–array interface. Phospho-Zap70 (green, Right) did not show this preferential localization. Cell morphology was visualized using anti-CD45 Fab fragments (blue). Scale bar: 5 µm. (C) Wash-in of the SFK inhibitor PP2 reduces traction forces. Data represent at least 90 pillars from eight cells over two independent experiments for each condition. *P < 0.05 compared with no PP2, dual-tailed t test. (D) PP2 treatment reduced overall intensity of pPyk2 staining on planar PDMS coated with OKT3 + CD28.6. Control and inhibited samples were imaged in parallel for each experiment, and normalized to the noninhibited condition. Data are mean ± SD from >200 cells per surface, from more than three independent experiments. *P < 0.05 compared with no PP2.
Fig. 4.
Fig. 4.
T cells generate traction forces through TCR–pMHC. (A) Primary CD4+ T cell from mouse expressing the 5C.C7 transgenic TCR (cyan, visualized using α-CD45 Fabs) on a pillar array coated with species-appropriate α-CD3 antibody (red); α-CD28 is included in the cell culture media. Scale bar: 2 µm and 500 pN (for forces indicated as arrows). (B) Average traction force and number of underlying pillars for cells on surfaces presenting α-CD3 antibody or MCC-loaded I-Ek MHC to target the TCR complex (TCR cplx). CD28 was applied either in solution (sol’n) or coadsorbed onto the pillar. Data are mean ± SD, representing 10–15 cells per condition, and were analyzed using ANOVA and Tukey methods, α = 0.05. Data of force per pillar were not statistically different by ANOVA; grouping overbars are omitted. For data of pillar number, the red overbars group conditions that were not significantly different.

References

    1. Barda-Saad M, et al. Dynamic molecular interactions linking the T cell antigen receptor to the actin cytoskeleton. Nat Immunol. 2005;6(1):80–89. - PubMed
    1. Gomez TS, et al. Formins regulate the actin-related protein 2/3 complex-independent polarization of the centrosome to the immunological synapse. Immunity. 2007;26(2):177–190. - PMC - PubMed
    1. DeMond AL, Mossman KD, Starr T, Dustin ML, Groves JT. T cell receptor microcluster transport through molecular mazes reveals mechanism of translocation. Biophys J. 2008;94(8):3286–3292. - PMC - PubMed
    1. Grakoui A, et al. The immunological synapse: A molecular machine controlling T cell activation. Science. 1999;285(5425):221–227. - PubMed
    1. Ilani T, Vasiliver-Shamis G, Vardhana S, Bretscher A, Dustin ML. T cell antigen receptor signaling and immunological synapse stability require myosin IIA. Nat Immunol. 2009;10(5):531–539. - PMC - PubMed

Publication types