

Exposure to ambient black carbon derived from a unique inventory and high-resolution model
- PMID: 24469822
- PMCID: PMC3932916
- DOI: 10.1073/pnas.1318763111
Exposure to ambient black carbon derived from a unique inventory and high-resolution model
Abstract
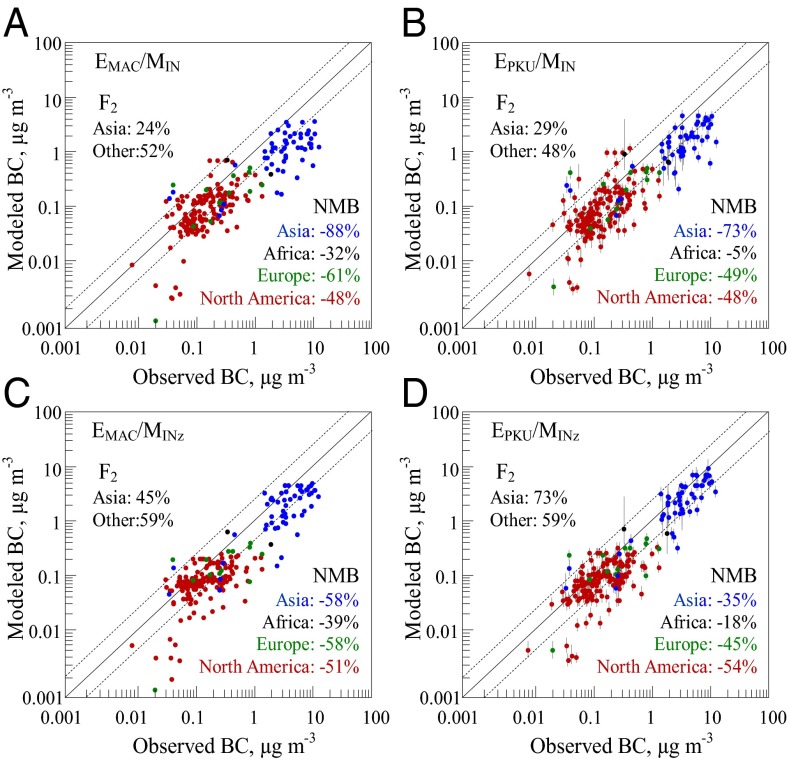
Black carbon (BC) is increasingly recognized as a significant air pollutant with harmful effects on human health, either in its own right or as a carrier of other chemicals. The adverse impact is of particular concern in those developing regions with high emissions and a growing population density. The results of recent studies indicate that BC emissions could be underestimated by a factor of 2-3 and this is particularly true for the hot-spot Asian region. Here we present a unique inventory at 10-km resolution based on a recently published global fuel consumption data product and updated emission factor measurements. The unique inventory is coupled to an Asia-nested (∼50 km) atmospheric model and used to calculate the global population exposure to BC with fully quantified uncertainty. Evaluating the modeled surface BC concentrations against observations reveals great improvement. The bias is reduced from -88% to -35% in Asia when the unique inventory and higher-resolution model replace a previous inventory combined with a coarse-resolution model. The bias can be further reduced to -12% by downscaling to 10 km using emission as a proxy. Our estimated global population-weighted BC exposure concentration constrained by observations is 2.14 μg⋅m(-3); 130% higher than that obtained using less detailed inventories and low-resolution models.
Keywords: air pollution; climate change; emission inventory; model resolution.
Conflict of interest statement
The authors declare no conflict of interest.
Figures


References
-
- Shindell D, et al. Simultaneously mitigating near-term climate change and improving human health and food security. Science. 2012;335(6065):183–189. - PubMed
-
- Janssen NAH, et al. Health Effects of Black Carbon. Copenhagen: World Health Organization; 2012.
-
- Geng F, et al. Differentiating the associations of black carbon and fine particle with daily mortality in a Chinese city. Environ Res. 2013;120:27–32. - PubMed
-
- Wang X, et al. Associations between fine particle, coarse particle, black carbon and hospital visits in a Chinese city. Sci Total Environ. 2013;458–460:1–6. - PubMed
-
- Koch D, et al. Evaluation of black carbon estimations in global aerosol models. Atmos Chem Phys. 2009;9(22):9001–9026.
Publication types
MeSH terms
Substances
LinkOut - more resources
Full Text Sources
Other Literature Sources
