. 2014 Feb 11;111(6):2307-12.
doi: 10.1073/pnas.1318249111. Epub 2014 Jan 27.

Persistent HIV-1 replication is associated with lower antiretroviral drug concentrations in lymphatic tissues

Affiliations

Persistent HIV-1 replication is associated with lower antiretroviral drug concentrations in lymphatic tissues

Courtney V Fletcher et al. Proc Natl Acad Sci U S A. .

Abstract

Antiretroviral therapy can reduce HIV-1 to undetectable levels in peripheral blood, but the effectiveness of treatment in suppressing replication in lymphoid tissue reservoirs has not been determined. Here we show in lymph node samples obtained before and during 6 mo of treatment that the tissue concentrations of five of the most frequently used antiretroviral drugs are much lower than in peripheral blood. These lower concentrations correlated with continued virus replication measured by the slower decay or increases in the follicular dendritic cell network pool of virions and with detection of viral RNA in productively infected cells. The evidence of persistent replication associated with apparently suboptimal drug concentrations argues for development and evaluation of novel therapeutic strategies that will fully suppress viral replication in lymphatic tissues. These strategies could avert the long-term clinical consequences of chronic immune activation driven directly or indirectly by low-level viral replication to thereby improve immune reconstitution.

Keywords: FDC network; drug levels; pharmacokinetics.


Conflict of interest statement

The authors declare no conflict of interest.

Figures

Fig. 1.
Fig. 1.
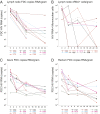
IC ARV concentrations by compartment and month of therapy. Mean (and SD error) IC concentrations (log scale) for TFV-DP, FTC-TP, ATV, DRV, and EFV are shown for PBMCs (A), LN MNCs (B), ileal MNCs (C), and rectal MNCs (D). For B, where values were below the limit of quantitation (BLQ), a value of 1 has been assigned for illustration purposes; for example, all LN samples for ATV had IC concentrations that were BLQ. (E) Overall median percent difference between the concentration in PBMCs and those in the LN, ileum, and rectum, respectively, for each of the five drugs from all samples obtained during the 6 mo of therapy in the individual subjects. The scale is truncated at +100%. Actual values >100% were as follows: TFV-DP, 2,229%, and DRV, 1,318% in the ileum; and TFV-DP, 599%, and DRV, 149% in the rectum. In the LN, concentrations were uniformly lower than PBMCs for all drugs: TFV-DP concentrations, −80%; FTC-TP, −66%; ATV, −100%; DRV, −99%; and EFV, −94% (all P < 0.0001). TFV-DP, TFV-diphosphate; FTC-TP, FTC-triphosphate.
Fig. 2.
Fig. 2.
Plasma HIV RNA is plotted against time. All patients except one (1,774) had a prompt reduction in plasma VL to <48 copies per milliliter. Note that the lower limit of detection was 75 copies per milliliter for patients 1,669; 1,679; and 1,680 through M5, M2, and week 2, respectively when the Siemens Medical Solutions Diagnostics Versant HIV-1 RNA 3.0 Assay (bDNA) was in use in the clinical laboratory where samples were analyzed. All other samples were analyzed by using the Roche COBAS AmpliPrep/COBAS TaqMan HIV-1 test, and the lower limit of detection was 48 copies per milliliter (dotted line).
Fig. 3.
Fig. 3.
Decay of the FDCn pool and individual vRNA+ cells in LN under combination antiretroviral therapy. (A and B) As described in the text, for the 12 patients as a group, the FDCn pool of virions decayed exponentially with the expected half-life of ∼2 wk (A; Table 2), and there was the expected correlation between vRNA in the FDCn pool and vRNA+ cells (B; Table 3). Note that for four of the patients, the FDCn pool decayed as expected between baseline and M3 and then plateaued or increased (identified in A with a box drawn around the M6 data points). (C and D) The decay rates of vRNA in the FDCn of ileum (C) and rectum (D) are shown. They have slightly longer half-lives but still show good correlation with the number of vRNA+ MNCs in the adjacent parafollicular T-cell zone.
Fig. 4.
Fig. 4.
The different rates of decay of HIV RNA from the FDCn of LN are illustrated in four subjects at baseline, M1, M3, and M6 (M3 LN is missing for subject 1,669 because a LN was not found during the procedure). Subject 1,669 demonstrates no significant decrease over a 6-mo interval. In contrast, subjects 1,679 and 1,727 demonstrated an initial decline and then the copies of HIV RNA on the FDCn declined more slowly at almost a flat rate. In contrast, in subject 1,774, the decay of the FDCn pool was continuous. These three patterns (no decay, initial decay and then leveling off, and continuous decay) were seen in these 12 subjects. Of note, the first two patterns are indicative of ongoing replication as the decreased rate of decay of the FDCn pool or increases in the pool indicate replenishment from virus production.
Fig. 5.
Fig. 5.
Representation of the association between the decay rate of virions from the FDC pool and the mean quantity of drug for TFV-DP (black), FTC-TP (red), and EFV (green), showing faster decay of virions with higher concentrations of drug. Mixed-effects models detected significant negative associations between the magnitude of the FDC pool and drug concentrations for TFV-DP (P = 0.0242) and FTC-TP (P = 0.0204), averaging over all compartments and between the decay rate of the virions from the FDC pool and the quantity of TFV-DP (P = 0.0027) and EFV (P = −0.0023) in LN.

Comment in

References

    1. Estes J, et al. Collagen deposition limits immune reconstitution in the gut. J Infect Dis. 2008;198(4):456–464. - PMC - PubMed
    1. Guadalupe M, et al. Severe CD4+ T-cell depletion in gut lymphoid tissue during primary human immunodeficiency virus type 1 infection and substantial delay in restoration following highly active antiretroviral therapy. J Virol. 2003;77(21):11708–11717. - PMC - PubMed
    1. Mehandru S, et al. Primary HIV-1 infection is associated with preferential depletion of CD4+ T lymphocytes from effector sites in the gastrointestinal tract. J Exp Med. 2004;200(6):761–770. - PMC - PubMed
    1. Carcelain G, Autran B. Immune interventions in HIV infection. Immunol Rev. 2013;254(1):355–371. - PubMed
    1. Hunt PW, et al. Relationship between T cell activation and CD4+ T cell count in HIV-seropositive individuals with undetectable plasma HIV RNA levels in the absence of therapy. J Infect Dis. 2008;197(1):126–133. - PMC - PubMed

Publication types

Substances