. 2014 Feb;143(2):183-201.
doi: 10.1085/jgp.201311033.

PLC-mediated PI(4,5)P2 hydrolysis regulates activation and inactivation of TRPC6/7 channels

Affiliations

PLC-mediated PI(4,5)P2 hydrolysis regulates activation and inactivation of TRPC6/7 channels

Kyohei Itsuki et al. J Gen Physiol. 2014 Feb.

Abstract

Transient receptor potential classical (or canonical) (TRPC)3, TRPC6, and TRPC7 are a subfamily of TRPC channels activated by diacylglycerol (DAG) produced through the hydrolysis of phosphatidylinositol 4,5-bisphosphate (PI(4,5)P2) by phospholipase C (PLC). PI(4,5)P2 depletion by a heterologously expressed phosphatase inhibits TRPC3, TRPC6, and TRPC7 activity independently of DAG; however, the physiological role of PI(4,5)P2 reduction on channel activity remains unclear. We used Förster resonance energy transfer (FRET) to measure PI(4,5)P2 or DAG dynamics concurrently with TRPC6 or TRPC7 currents after agonist stimulation of receptors that couple to Gq and thereby activate PLC. Measurements made at different levels of receptor activation revealed a correlation between the kinetics of PI(4,5)P2 reduction and those of receptor-operated TRPC6 and TRPC7 current activation and inactivation. In contrast, DAG production correlated with channel activation but not inactivation; moreover, the time course of channel inactivation was unchanged in protein kinase C-insensitive mutants. These results suggest that inactivation of receptor-operated TRPC currents is primarily mediated by the dissociation of PI(4,5)P2. We determined the functional dissociation constant of PI(4,5)P2 to TRPC channels using FRET of the PLCδ Pleckstrin homology domain (PHd), which binds PI(4,5)P2, and used this constant to fit our experimental data to a model in which channel gating is controlled by PI(4,5)P2 and DAG. This model predicted similar FRET dynamics of the PHd to measured FRET in either human embryonic kidney cells or smooth muscle cells, whereas a model lacking PI(4,5)P2 regulation failed to reproduce the experimental data, confirming the inhibitory role of PI(4,5)P2 depletion on TRPC currents. Our model also explains various PLC-dependent characteristics of channel activity, including limitation of maximum open probability, shortening of the peak time, and the bell-shaped response of total current. In conclusion, our studies demonstrate a fundamental role for PI(4,5)P2 in regulating TRPC6 and TRPC7 activity triggered by PLC-coupled receptor stimulation.


Figures
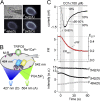
Figure 1.
Figure 1.
Simultaneous measurement of receptor-operated TRPC6 currents and PI(4,5)P2 detected by 3-cube FRET. (A) Images of PI(4,5)P2 sensor expressed in HEK293 cells using a 3-cube filter. Phase-contrast image (top left), YFP channel (F542(A); top right), CFP channel (F464(D); bottom left), and FRET channel (F542(D); bottom right) are shown. (B) Diagram of molecules transfected into HEK293 cells. TRPC6, PI(4,5)P2 sensor (CFPmse-PHd [blue box] and YFPmse-PHd [yellow box]), and M1R were expressed. The excitation wavelengths, 427 and 504 nm, were alternately illuminated. (C) Typical example of CCh-induced TRPC6 currents (top) and the corresponding FRET changes (middle). The FR (middle; circles) calculated by 3-cube methods can yield near absolute FRET efficiency (EEFF; right axis). Measured parameters were the duration of Δ10–90% and Δ90–50% of the peak current, the kinetics of FRET decay (τFR), and minimum FR (FRmin). The decline of FRET (FR) was fitted with a single-exponential decay (red solid curve): FR=FRmin+FRΔ×exp(t/τFR). The bottom panel shows the changes in the fluorescence intensities (a.u.) that passed through the respective filter setting.
Figure 2.
Figure 2.
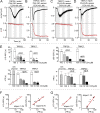
Correlation between the TRPC6/7 currents and the decay of PI(4,5)P2. (A and B) Example traces of TRPC6 currents (top) and FRET of PI(4,5)P2 sensor (CFPmse-PHd and YFPmse-PHd) (bottom) upon stimulation with 100 µM CCh of either endogenous (A) or overexpressed M1R (B). (C and D) Same as in A and B, but in cells expressing TRPC7. (E) Summary of currents and FRET changes. TRPC6/7 current increase (Δ10–90%) and decay (Δ90–50%), kinetics of FRET reduction (τFR), and degree of FRET reduction (FRmin) were accelerated in a CCh concentration and M1R expression-dependent manner. The data depicted by the stripe and the white bars show without channel expression (transfected only PI(4,5)P2 sensor) and endogenous receptor simulation, respectively. Numbers in parentheses indicate the number of cells measured, here and throughout. (F and G) Time courses of the Δ10–90% and Δ90–50% of receptor-operated currents were plotted against the simultaneously measured τFR (F, TRPC6; G, TRPC7). These data were obtained from various concentrations of CCh or level of M1R expression. The slope with a linear fit highlights a relationship between the time courses and τFR.
Figure 3.
Figure 3.
Incompatible correlation between receptor-operated TRPC6/7 currents and DAG production. (A) Principle of DAG detection by PKC probe FRET. Increments in FRET caused by the translocation of PKCε-CFPmse to the plasma membrane were detected by a coexpressed membrane-resident acceptor protein (Mry-YFPmse) in HEK293 cells. (B) Whole-cell TRPC6 currents (top) and FRET changes caused by DAG increments, “FRdag” (bottom, green circles), recorded from endogenous muscarinic receptor stimulation with 100 µM CCh. The rise of FRET was fitted to the exponential equation: FRdag=FRdagmaxΔFRdag×exp(t/τFRdag) (green solid curve). (C) Traces of currents and FRdag in M1R-overexpressing cells with 100 µM CCh. (Left) TRPC6 currents. (Right) TRPC7 currents. Prolonged DAG production was observed. Purple zones indicate inconsistencies between current inactivation and DAG production. The inset in the TRPC7 panel shows FRdag changes over a longer time scale (300 s). (D) Summary of FRdag levels at the respective current points observed in the robust receptor stimulation (+M1R and 100 µM). The black and gray bars denote expression of TRPC6 and TRPC7 channels, respectively. (E) Time courses of initial phase of current increase (Δ10–30%) were plotted against kinetics of DAG production (τFRdag).
Figure 4.
Figure 4.
TRPC current inhibition and PI(4,5)P2 reduction in response to the protocol for measuring the voltage dependence of DrVSP activation. (A) TRPC6, CFPmse-PHd, YFPmse-PHd (PI(4,5)P2 sensor), and voltage-sensing phosphatase (DrVSP) were coexpressed in HEK293 cells. Gradual current inhibition and reduction in PI(4,5)P2 caused by the step-pulse protocol (left; from 20 to 180 mV; duration of 500 ms; repeated every 25 s). A DAG lipase inhibitor (RHC80267; 100 µM) was applied to induce the currents (gray horizontal bar). The ratio of current inhibition, r(I), and FRET reduction, r(FR), upon the depolarization pulses was used to quantify the channel activity and PI(4,5)P2 changes after DrVSP activation (right). (B) The voltage dependence of current inhibition (left axis; circles) and FR reduction (right axis; triangles) after DrVSP activation in cells expressing TRPC3 (left), TRPC6 (middle), and TRPC7 (right) channels.
Figure 5.
Figure 5.
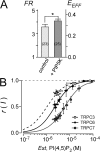
Functional dissociation constants of PI(4,5)P2 binding to TRPC3/6/7 channels. (A) Comparison of FR or EEFF in the resting condition between cells expressing TRPC6 channel and CFPmse-PHd and YFPmse-PHd (control), and those overexpressing PIP5K (+PIP5K). The FR of cells overexpressing PIP5K increased on average by ∼1.2-fold compared with control cells. *, P < 0.05; unpaired t test. (B) Steady-state plots for estimating the functional Kd of PI(4,5)P2 binding to TRPC3/6/7 channels. Horizontal axis indicates the estimated PI(4,5)P2 concentration based on the conversion from FR to PI(4,5)P2, according to Eq. 5.
Figure 6.
Figure 6.
PI(4,5)P2 reaction model and channel gating models (DG and SPD) used for simulations. (A) Minimal PI(4,5)P2–DAG reaction scheme (top). Hydrolysis of PI(4,5)P2 (local) is the first step in this model (ki). The produced DAG can serve as a substrate for DAG kinase, DAG lipase, and DAG acetyltransferase. For simplicity, we refer only to DAG kinase (kii). PA, phosphatidic acid. Further catalytic steps for the producing of CDP-DAG and PI were bound to directly generate PI(4)P (kiii). The PI(4,5)P2 recovery from PI(4)P by PIP5K is referred to as “kiv”. PI(4,5)P2 and DAG concentrations are linked to the three-state DG (bottom left) and the four-state SPD (bottom right) models. (B) Comparison of TRPC6 current data processed through the DG and SPD simulation models with parameters of the accelerated PLC kinetics. The top panel shows that a rapid decay of TRPC6 current was seen with the SPD model (red trace), but not with the DG model (orange trace). The current amplitudes were normalized to their peak currents (Norm.current). The bottom panel shows the simulated dynamics of PI(4,5)P2 (solid line) and DAG (dashed line) concentrations.
Figure 7.
Figure 7.
SPD model fitting to experimentally observed TRPC6/7 currents and AVP-evoked TRPC6/7-like currents in A7r5 cells. (A) Fitting of the receptor-operated TRPC6 current simultaneously measured with PI(4,5)P2 by FRET with the SPD model (top; light blue trace). The experimental data were obtained from the low strength of receptor stimulation carried by CCh application (100 µM) to endogenous muscarinic receptor in HEK293 cells. Back-calculated FR of PI(4,5)P2 concentrations at the respective points (bottom; solid) was normalized against the time zero FR (Norm.FR; middle; light blue), and that was overlaid on the experimental Norm.FR (middle; circles). The bottom panel displays the fitting resultant changes in PI(4,5)P2 (solid), DAG (dashed), and PA (thin dashed). The similarity of Norm.FR was assessed by SD as described in Materials and methods. (B) Fitting of experimental TRPC6 current data from M1R-overexpressing cells. The initial parameters are identical to those in A. (C) Fitting of experimental TRPC6/7-like currents recorded from A7r5 aorta–derived smooth muscle cells. The currents were evoked by 1 µM AVP. The inset in the top panel shows A7r5 cells expressing the PI(4,5)P2 sensor. (D) Fitting of TRPC7 currents. Local PI(4,5)P2 dynamics were detected using a FRET donor linked to the TRPC7 channel at the end of its C-terminal domain (top; inset). Transient increments in FRET were detected during the plateau or biphasic response (middle; arrow).
Figure 8.
Figure 8.
Proposed contribution of PI(4,5)P2 reduction in receptor-operated TRPC6/7 currents. (A) Representative SPD model simulations for receptor-operated TRPC6 currents (top) and FRET by PI(4,5)P2 sensor (bottom) from various PLC activities (ki). ki varied from 0.03 to 1.0 (s−1). The same color curves displayed in each panel were calculated from the same ki value. (B) The various kinetics of PI(4,5)P2 reduction (τFR) according to the changes in PLC activity (ki) impact activation (left; Δ10–90%) and inactivation (right; Δ90–50%) of TRPC6/7 channel currents. Shown are the prediction made by the DG model (black) and the SPD model (red) for TRPC6 (circles) and TRPC7 channels (triangles). The star in the panels indicates the result from the ki setting of 0.7. The solid and dashed lines indicate the current–τFR relationships experimentally observed in TRPC6 and TRPC7, respectively. The direction of the arrows and its size indicate the gap from the DG to SPD model. (C) Simulation results of PLC-dependent characteristics of TRPC6/7 channels by DG (black) and SPD (red) models. (Left) The relationship between maximum open probability (Pomax) and ki. (Middle) The time required to peak currents (s) and ki. (Right) The total ionic influx and ki. t = 30 s.

Comment in

References

    1. Albert A.P., Piper A.S., Large W.A. 2005. Role of phospholipase D and diacylglycerol in activating constitutive TRPC-like cation channels in rabbit ear artery myocytes. J. Physiol. 566:769–780 10.1113/jphysiol.2005.090852 - DOI - PMC - PubMed
    1. Ambudkar I.S., Bandyopadhyay B.C., Liu X., Lockwich T.P., Paria B., Ong H.L. 2006. Functional organization of TRPC-Ca2+ channels and regulation of calcium microdomains. Cell Calcium. 40:495–504 10.1016/j.ceca.2006.08.011 - DOI - PubMed
    1. Beech D.J., Muraki K., Flemming R. 2004. Non-selective cationic channels of smooth muscle and the mammalian homologues of Drosophila TRP. J. Physiol. 559:685–706 10.1113/jphysiol.2004.068734 - DOI - PMC - PubMed
    1. Bousquet S.M., Monet M., Boulay G. 2010. Protein kinase C-dependent phosphorylation of transient receptor potential canonical 6 (TRPC6) on serine 448 causes channel inhibition. J. Biol. Chem. 285:40534–40543 10.1074/jbc.M110.160051 - DOI - PMC - PubMed
    1. Bousquet S.M., Monet M., Boulay G. 2011. The serine 814 of TRPC6 is phosphorylated under unstimulated conditions. PLoS ONE. 6:e18121 10.1371/journal.pone.0018121 - DOI - PMC - PubMed

Publication types