. 2014 Mar 1;192(5):2227-36.
doi: 10.4049/jimmunol.1302904. Epub 2014 Jan 27.

E and Id proteins influence invariant NKT cell sublineage differentiation and proliferation

Affiliations

E and Id proteins influence invariant NKT cell sublineage differentiation and proliferation

Louise M D'Cruz et al. J Immunol. .

Abstract

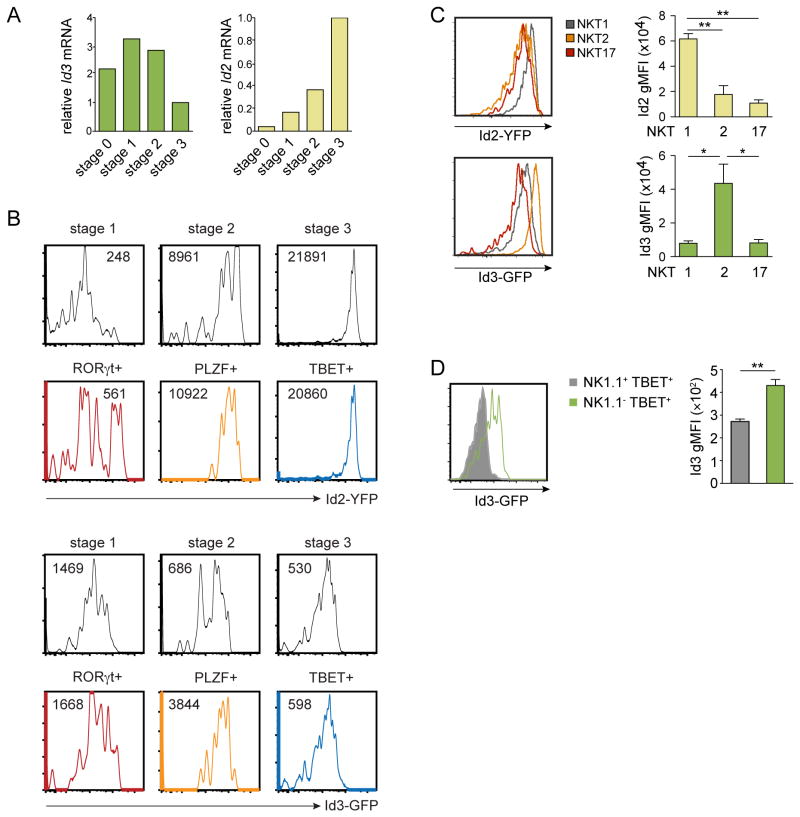
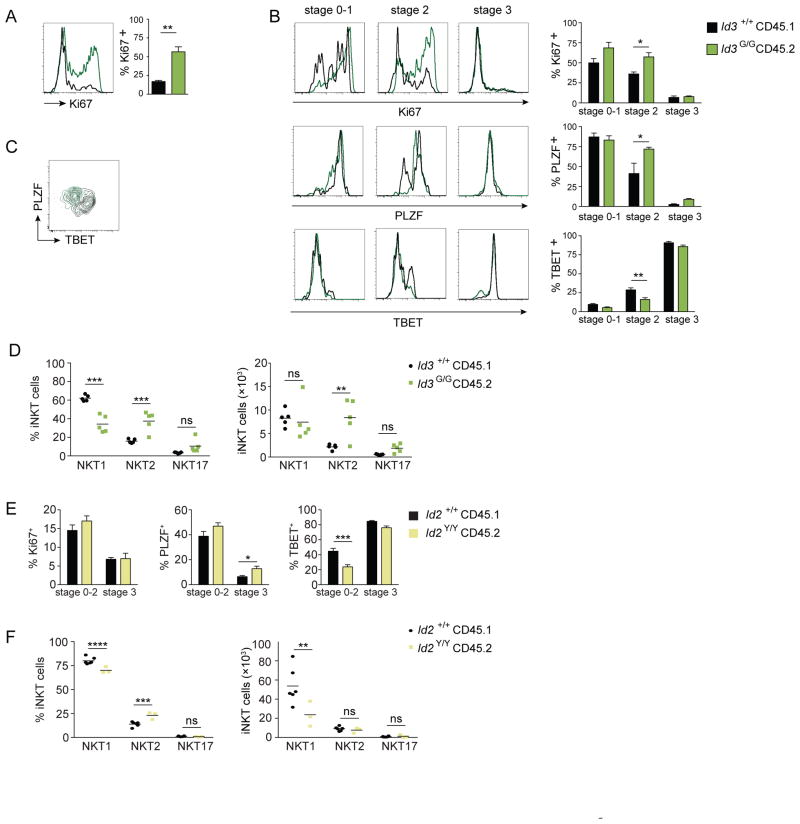
Disease outcome is known to be influenced by defined subsets of invariant NKT (iNKT) cells residing in distinct locations within peripheral tissue. However, the factors governing the development of these unique iNKT sublineages during thymic development are unknown. In this study we explored the mechanism by which E protein transcription factors and their negative regulators, the Id proteins, control the development of iNKT sublineages after positive selection. We found that E proteins directly bound the promyelocytic leukemia zinc finger (PLZF) promoter and were required for expression of this lineage-defining transcription factor and for the maturation and expansion of thymic iNKT cells. Moreover, expression of the negative regulators of E proteins, Id2 and Id3, defined distinct iNKT cell sublineages. Id3 was expressed in PLZF(high) NKT2 cells and loss of Id3 allowed for increased thymic iNKT cell expansion and abundance of the PLZF(+) NKT2 sublineage. Id2 was expressed in T-BET(+) NKT1 cells, and both Id proteins were required for the formation of this sublineage. Thus, we provide insight into E and Id protein regulation of iNKT cell proliferation and differentiation to specific sublineages during development in the thymus.


Figures

Figure 1
Figure 1. Loss of E protein expression impairs iNKT cell maturation
Tcf3+/+Tcf12+/+Cd4cre- or Tcf3f/f Tcf12f/f Cd4cre+ mice expressing a Vα14-Jα18 TCR transgene were characterized. (A) Flow cytometric analysis of iNKT cell frequency in Vα14-Jα18tg+Tcf3+/+Tcf12+/+Cd4cre- and Vα14-Jα18tg+Tcf3f/fTcf12f/fCd4cre+ lymphocytes from indicated tissues. Numbers indicate percentage of cells within the drawn gate. (B) Average frequency or (C) absolute number (±SEM) of CD1d-tet+TCRβ+ gated iNKT cells from the indicated genotype and tissue. (D) Flow cytometric analysis of CD1d-tet+CD24+ expression in the thymus and CD44+NK1.1+ expression by gated iNKT lymphocytes from the indicated genotype in the indicated tissue. (E) Average frequency and absolute number (±SEM) of maturation stages as defined by CD1d-tet and CD24 or CD44 and NK1.1 expression on CD1d-tet+TCRβ+ gated iNKT cells from the indicated genotype in the thymus. Stage 0 cells are defined by CD1d-tet+CD24+ expression. Gated CD1d-tet+CD24- cells define stages 1, 2 and 3. Graphs are the average of 11 mice from 8 independent experiments. Statistical significance was determined using unpaired two-tailed t test, ns = not significant, *, P < 0.05, **, P < 0.005, ***, P < 0.0005, ****, P < 0.0001.
Figure 2
Figure 2. E proteins regulate proliferation and PLZF expression in thymic iNKT cells
(A) Ki-67 expression by stage 0 and stage 1 CD1d-tet+TCRβ+ gated iNKT thymocytes from the indicated genotypes. Numbers indicate percentage Ki-67+ cells within the gate. Bar graphs indicate average frequency (±SEM) of CD1d-tet+TCRβ+ gated iNKT Ki-67+ cells at stage 0 and 1. Graphs are an average of 6 mice from 3 individual experiments. Statistical significance was determined using unpaired two-tailed t test, *, P < 0.05. (B) Bar graphs indicate relative expression of zbtb16 mRNA by stage 0 and 1 CD1d-tet+TCRβ+ gated iNKT cells determined by qPCR. Data are normalized to Vα14-Jα18tg+Tcf3+/+Tcf12+/+Cd4cre- cells and are the average of 3 individual samples from 3 independent experiments. Histogram plots indicate PLZF expression by stage 0 and 1 CD1d-tet+TCRβ+ CD1d-tet+TCRβ+ gated iNKT cells from the indicated genotypes. Numbers indicate percentage of PLZFhigh cells within the gate. Data are representative of 3 independent experiments with n = 1 – 3 mice per group. Statistical significance was determined using unpaired two-tailed t test, **, P < 0.005, ****, P < 0.0001. (C) The zbtb16 promoter is a direct target of E2A and HEB. Schematic indicating position of E box sites in the zbtb16 promoter relative to the ATG start site. Thymic iNKT cells from the indicated genotypes were sorted at stage 0 (CD1d-tet+TCRβ+CD24+) and chromatin was precipitated with anti-E2A, anti-HEB or control IgG antibodies. The relative amounts of input or precipitated DNA containing the indicated E box sites were determined by qPCR. Fold change of Vα14-Jα18tg+Tcf3+/+Tcf12+/+Cd4cre- pull-down over Vα14-Jα18tg+Tcf3f/f Tcf12f/f Cd4cre+ control are graphed and are an average of sorted cells from 3 mice for Vα14-Jα18tg+Tcf3+/+Tcf12+/+Cd4cre- and 2 mice for Vα14-Jα18tg+Tcf3f/fTcf12f/f Cd4cre+.
Figure 3
Figure 3. Id2 and Id3 expression define iNKT cell developmental stages and sublineages in the thymus
(A) Relative Id3 and Id2 mRNA expression levels by sorted wild-type thymic CD1d-tet+TCRβ+ iNKT cells. Relative expression indicated is normalized to stage 3 mRNA levels. Data are representative of three independent experiments. (B) Histograms showing Id3-GFP and Id2-YFP reporter expression by CD1d-tet+TCRβ+ gated iNKT cells at stage 1 (CD24-CD44-NK1.1-), stage 2 (CD24-CD44+NK1.1-) and stage 3 (CD24-CD44+NK1.1+) or by iNKT cells expressing TBET, PLZF or RORγt in the thymus. Numbers in histograms indicate mean fluorescence intensity (MFI). Data are representative of 3 mice per group from 3 independent experiments. (C) Histograms showing Id2-YFP and Id3-GFP expression in gated CD1d-tet+TCRβ+ TBET+ NKT1, PLZFhigh NKT2 and RORγt+ NKT17 cells respectively. Bar graphs indicate average Id2-YFP and Id3-GFP MFI of indicated sublineages. (E) Histogram showing Id3-GFP expression of NK1.1- TBET+ (green line) and NK1.1+ TBET+ (grey line) cells. Bar graph indicates average Id3-GFP MFI of indicated cell type. Data are average (±SEM) of 3 mice from 3 independent experiments. Statistical significance was determined using one-way ANOVA and Bonferroni post-hoc test, *, P < 0.05, **, P < 0.005.
Figure 4
Figure 4. Compensation by Id2 and Id3 as iNKT cells differentiate in the thymus
Flow cytometric analysis showing CD44+NK1.1+ expression by CD1d-tet+TCRβ+ gated iNKT cells from (A) wild type (WT), Id2-deficient (Id2Y/Y) and Id2-deficient Id3-heterozygote (Id2Y/YId3G/+) fetal liver chimeras and (B) wild type (WT), Id3-deficient (Id3G/G) and Id3-deficient Id2-heterozygote (Id3G/GId2Y/+) fetal liver chimeras. Bar graphs indicate iNKT cell frequency and absolute number at stages 1, 2 and 3 of the indicated genotype. (C) Histograms and bar graphs indicate Id3-GFP expression by Id2-deficient cells and Id2-YFP expression by Id3-deficient cells for CD1d-tet+TCRβ+ gated iNKT cells in the thymus, spleen and liver. Data shown are an average (±SEM) of 4 fetal liver chimeras per group, representative of 2 independent experiments. Statistical significance was determined using one-way ANOVA or unpaired two-tailed t test, *, P < 0.05, **, P < 0.005, ***, P < 0.0005, ****, P < 0.0001.
Figure 5
Figure 5. Id3 controls iNKT cell accumulation and maturation
Mixed bone marrow chimeras were generated by transfer of a 2:1 mix of CD45.1 Id3+/+ with CD45.2 Id3G/G bone marrow into irradiated recipients. (A) Flow cytometry plots showing iNKT cell frequency in wild-type Id3+/+and Id3-deficient Id3G/G lymphocytes from indicated tissues. Numbers indicate percentage of cells within the gate. (B) Average frequency and absolute number (±SEM) of Id3+/+ and Id3G/G CD1d-tet+TCRβ+ iNKT cells or conventional αβ T cells from indicated tissues. (C) CD1d-tet+CD24+ and CD44+NK1.1+ expression by CD1d-tet+TCRβ+ gated Id3+/+ and Id3G/G iNKT thymocytes assessed by flow cytometry. Numbers indicate percentage of cells within the gate. (D) Average frequency and absolute number (±SEM) of maturation stages for CD1d-tet+TCRβ+ gated Id3+/+ and Id3G/G iNKT thymocytes. Data are average (±SEM) of 3 mice, representative of 3 independent experiments with n = 3 – 4 mice. Statistical significance was determined using unpaired two-tailed t test, ns = not significant, *, P < 0.05, **, P < 0.005, ***, P < 0.0005.
Figure 6
Figure 6. Id3 regulates proliferation and sublineage commitment in iNKT cells
Mixed bone marrow chimeras were generated by transfer of a 2:1 mix of Id3+/+ to Id3G/G bone marrow to irradiated recipients. (A) Histograms showing Ki-67 staining by gated wild-type (Id3+/+) (black line) and Id3-deficient (Id3G/G) (green line) iNKT cells from the thymus. Bar graphs indicate average frequency (±SEM) of Ki-67+ iNKT cells. (B) Histograms showing Ki-67, PLZF and TBET expression by CD1d-tet+TCRβ+ gated wild-type (Id3+/+) (black line) and Id3-deficient (Id3G/G) (green line) iNKT cells at stage 0–1, stage 2 and stage 3 in the thymus. Bar graphs indicate frequency of Ki-67+, PLZFhigh and TBET+ cells by CD1d-tet+TCRβ+ gated Id3+/+ and Id3G/G iNKT thymocytes at indicated developmental stages. Data are average (±SEM) of 3 mice, representative of 3 independent experiments. (C) Flow cytometry plot indicating PLZF and TBET expression by wild-type (Id3+/+) (black) and Id3-deficient (Id3G/G) (green) iNKT thymocytes. (D) Graphs of relative frequency and absolute number of TBET+ NKT1, PLZFhigh NKT2 and RORγt+ NKT17 cells of total gated Id3+/+ and Id3G/G iNKT thymocytes. Data are average of 5 mice, representative of 3 independent experiments. (E) Bar graphs indicate frequency of Ki-67+, PLZF+ and TBET+ cells by CD1d-tet+TCRβ+ gated Id2+/+ and Id2Y/Y iNKT thymocytes at indicated developmental stages. Data are average (±SEM) of 6 mice, representative of 2 independent experiments. (F) Graphs of relative frequency and absolute number of TBET+ NKT1, PLZFhigh NKT2 and RORγt+ NKT17 cells of total gated Id2+/+ and Id2Y/Y iNKT thymocytes. Data are average of 6 mice (Id2+/+) and 3 mice (Id2Y/Y), representative of 3 independent experiments. Statistical significance was determined using Mann Whitney U test and unpaired two-tailed t test where applicable, ns = not significant, *, P < 0.05, **, P < 0.005, ***, P < 0.0005.

Similar articles

Cited by

References

    1. Brennan PJ, Brigl M, Brenner MB. Invariant natural killer T cells: an innate activation scheme linked to diverse effector functions. Nat Rev Immunol. 2013;13:101–117. - PubMed
    1. Bendelac A, Savage PB, Teyton L. The biology of NKT cells. Annu Rev Immunol. 2007;25:297–336. - PubMed
    1. Berzins SP, Smyth MJ, Baxter AG. Presumed guilty: natural killer T cell defects and human disease. Nat Rev Immunol. 2011;11:131–142. - PubMed
    1. Montoya CJ, Pollard D, Martinson J, Kumari K, Wasserfall C, Mulder CB, Rugeles MT, Atkinson MA, Landay AL, Wilson SB. Characterization of human invariant natural killer T subsets in health and disease using a novel invariant natural killer T cell-clonotypic monoclonal antibody, 6B11. Immunology. 2007;122:1–14. - PMC - PubMed
    1. Watarai H, Sekine-Kondo E, Shigeura T, Motomura Y, Yasuda T, Satoh R, Yoshida H, Kubo M, Kawamoto H, Koseki H, Taniguchi M. Development and function of invariant natural killer T cells producing T(h)2- and T(h)17-cytokines. PLoS Biol. 2012;10:e1001255. - PMC - PubMed

Publication types

MeSH terms

Substances

LinkOut - more resources