. 2014 Jul;16(7):1010-21.
doi: 10.1093/neuonc/not304.

Integrating diffusion kurtosis imaging, dynamic susceptibility-weighted contrast-enhanced MRI, and short echo time chemical shift imaging for grading gliomas

Integrating diffusion kurtosis imaging, dynamic susceptibility-weighted contrast-enhanced MRI, and short echo time chemical shift imaging for grading gliomas

Sofie Van Cauter et al. Neuro Oncol. 2014 Jul.

Abstract

Background: We assessed the diagnostic accuracy of diffusion kurtosis imaging (DKI), dynamic susceptibility-weighted contrast-enhanced (DSC) MRI, and short echo time chemical shift imaging (CSI) for grading gliomas.

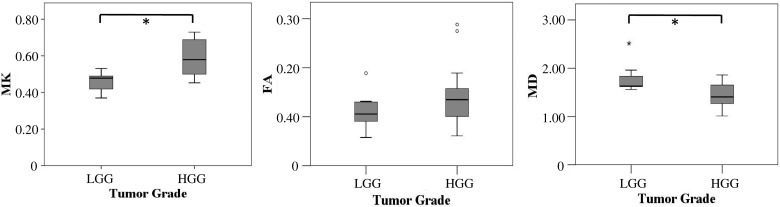
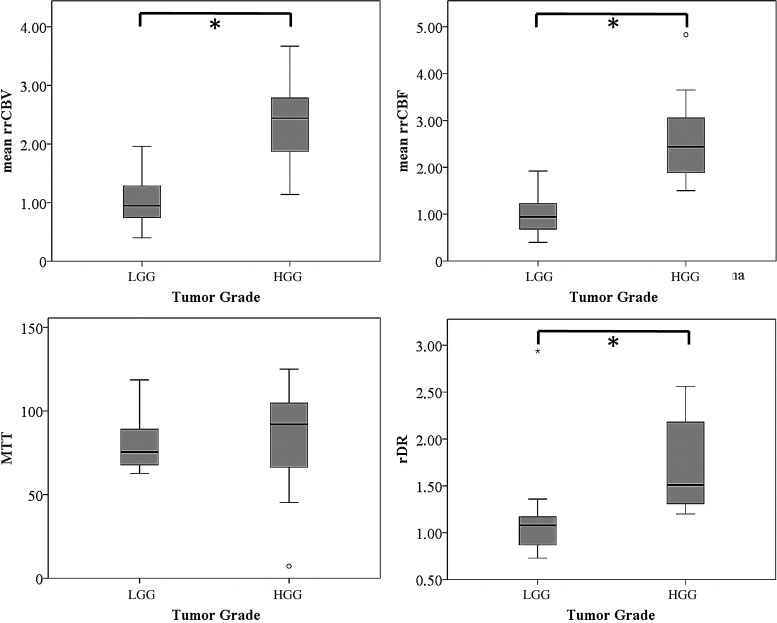
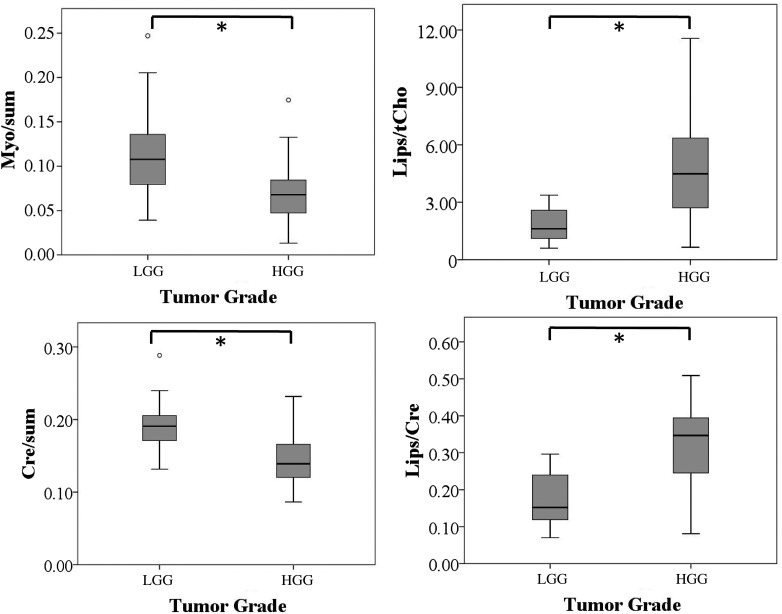
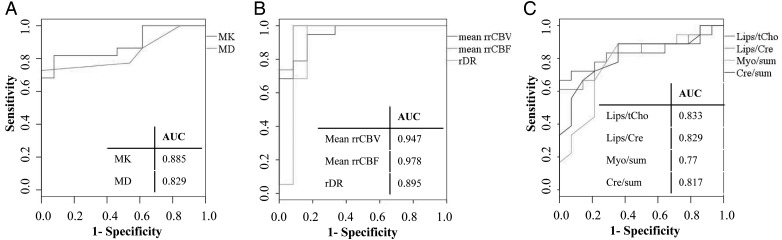
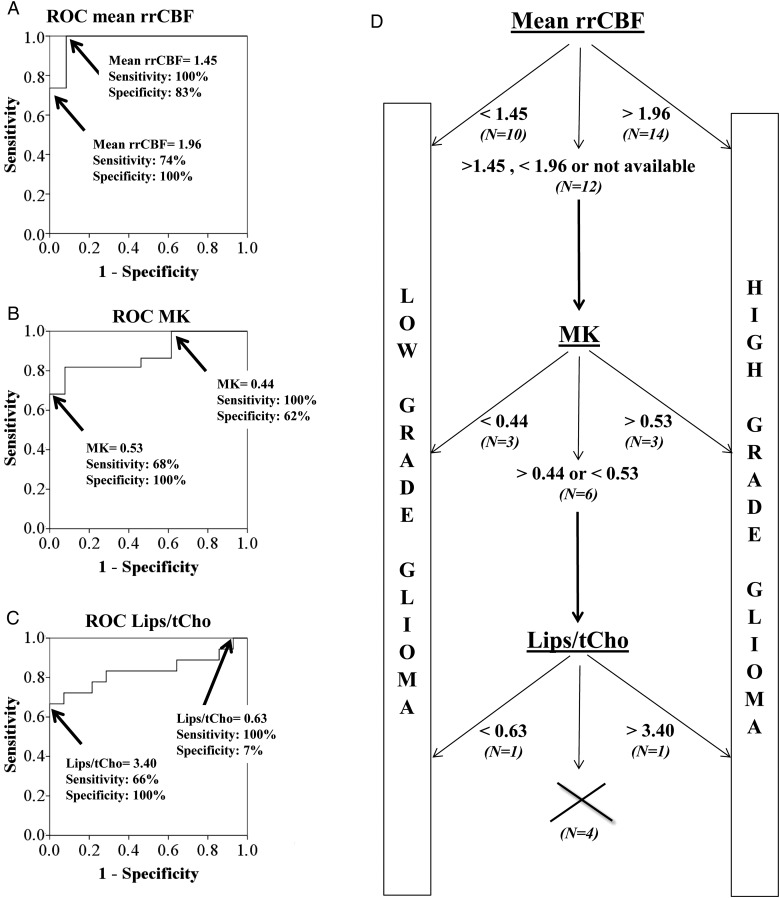
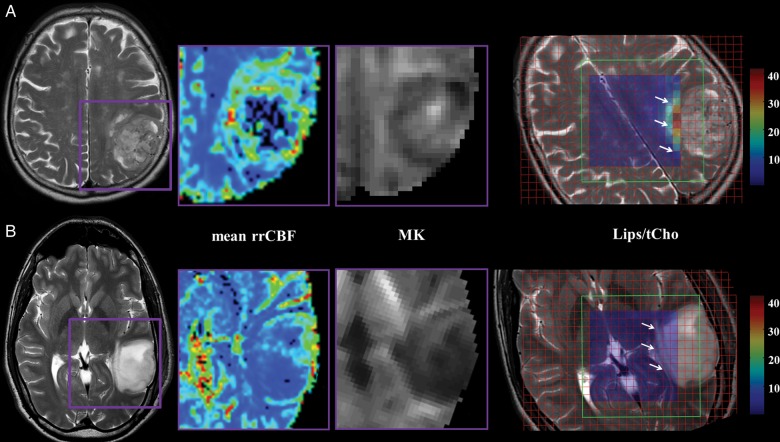
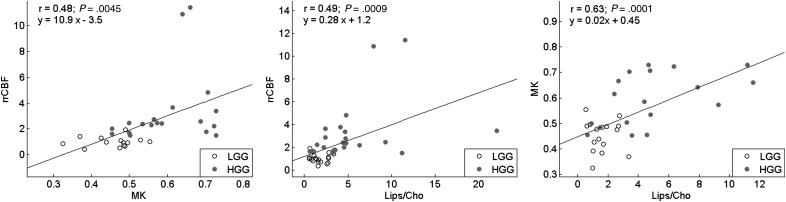
Methods: In this prospective study, 35 patients with cerebral gliomas underwent DKI, DSC, and CSI on a 3 T MR scanner. Diffusion parameters were mean diffusivity (MD), fractional anisotropy, and mean kurtosis (MK). Perfusion parameters were mean relative regional cerebral blood volume (rrCBV), mean relative regional cerebral blood flow (rrCBF), mean transit time, and relative decrease ratio (rDR). The diffusion and perfusion parameters along with 12 CSI metabolite ratios were compared among 22 high-grade gliomas and 14 low-grade gliomas (Mann-Whitney U-test, P < .05). Classification accuracy was determined with a linear discriminant analysis for each MR modality independently. Furthermore, the performance of a multimodal analysis is reported, using a decision-tree rule combining the statistically significant DKI, DSC-MRI, and CSI parameters with the lowest P-value. The proposed classifiers were validated on a set of subsequently acquired data from 19 clinical patients.

Results: Statistically significant differences among tumor grades were shown for MK, MD, mean rrCBV, mean rrCBF, rDR, lipids over total choline, lipids over creatine, sum of myo-inositol, and sum of creatine. DSC-MRI proved to be the modality with the best performance when comparing modalities individually, while the multimodal decision tree proved to be most accurate in predicting tumor grade, with a performance of 86%.

Conclusions: Combining information from DKI, DSC-MRI, and CSI increases diagnostic accuracy to differentiate low- from high-grade gliomas, possibly providing diagnosis for the individual patient.


Figures

Fig. 1.
Fig. 1.
Box plots of MK, fractional anisotropy (FA), and MD against tumor grade. Asterisk (*) indicates statistically significant differences (P < .05, Bonferroni corrected) of the respective diffusion parameters with tumor grade. MD values in 10−3 mm²/s. The remaining parameters are dimensionless. Error bars indicate interquartile ranges.
Fig. 2.
Fig. 2.
Box plots of mean rrCBV, mean rrCBF, MTT, and rDR against tumor grade. Asterisk (*) indicates statistically significant differences (P < .05, Bonferroni corrected) of the respective perfusion parameter with tumor grade. MTT values in seconds. The remaining parameters are dimensionless. Error bars indicate interquartile ranges.
Fig. 3.
Fig. 3.
Box plots of the statistically significant CSI parameters against tumor grade. For the box plots of all considered CSI parameters, refer to Supplementary Fig. 1. Asterisk (*) indicates statistically significant differences (P < .05, Bonferroni corrected) of the respective CSI parameters with tumor grade. All metabolite ratios are dimensionless. Error bars indicate interquartile ranges.
Fig. 4.
Fig. 4.
ROC curves and area under the curve values for MK and MD (panel A); mean rrCBV, mean rrCBF, and rDR (panel B); and Lips/tCho, Lips/Cre, Myo/sum, and Cre/sum (panel C) in solid tumor in order to differentiate between low- and high-grade glioma.
Fig. 5.
Fig. 5.
(A–C) ROC curves indicating the sensitivities and specificities of mean rrCBF-based, MK-based, and Lips/tCho-based differentiation between low- and high-grade gliomas, respectively. The 2 indicated points show the range where misclassifications can occur in this specific study population. The cutoff values indicated on the ROCs are an example obtained during a validation run randomly selected in the leave-one-out cross-validation. (D) Decision tree to distinguish low- from high-grade glioma in our study population based on the ranges of possible misclassification of mean rrCBF, MK, and Lips/tCho obtained for the leave-one-out cross-validation. The percentage of undecided cases after each decision step is indicated at each level. Nine percent of cases could not be classified using the proposed decision algorithm.
Fig. 6.
Fig. 6.
T2-weighted MRI, mean rrCBF, MK, and Lips/tCho maps of a 71-year-old female patient with GBM in the left parietal lobe (panel A) and a 35-year-old male patient with a grade II pilocytic astrocytoma in the left temporal lobe (panel B). The mean rrCBF and MK maps display the tumoral area in detail as indicated on the T2-weighted MRI with the purple box. Notice the high mean rrCBF and MK values in the high-grade glioma (top row) compared with the low-grade glioma (bottom row). The VOI of the CSI (green box) is superimposed on the T2-weighted images showing Lips/tCho ratios per voxel. The tumoral area is indicated with white arrows. Lips/tCho ratios are higher in high-grade glioma compared with low-grade glioma. Notice that only the center voxels are displayed in the color map for the sake of clarity, as the outer rows are affected by the chemical shift displacement error (CSDE). This CSDE can be defined as the difference in location of the center of the excitation or refocusing slices of 2 resonances with a different chemical shift, ie, Lips (0.9 and 1.3 ppm) and the carrier frequency of the water suppressed spectrum (2.2 ppm). Intensities of Lips/tCho are equally scaled in the parameter maps of the low- and high-grade glioma patient.
Fig. 7.
Fig. 7.
Relationships between MK and rrCBF (left), Lips/tCho and rrCBF (center), and Lips/tCho and MK (right). The fitted regression lines, Pearson correlation coefficients (r), P-values, and equation of the fitted line are shown. Low-grade glioma (LGG) cases are plotted as grey circles, while high-grade glioma (HGG) cases are plotted as black dots.

References

    1. Louis DN, Ohgaki H, Wiestler OD, et al. The 2007 WHO classification of tumours of the central nervous system. Acta Neuropathol. 2007;114(2):97–109. - PMC - PubMed
    1. McGirt MJ, Woodworth GF, Coon AL, et al. Independent predictors of morbidity after image-guided stereotactic brain biopsy: a risk assessment of 270 cases. J Neurosurg. 2005;102(5):897–901. - PubMed
    1. Scott JN, Brasher PM, Sevick RJ, Rewcastle NB, Forsyth PA. How often are nonenhancing supratentorial gliomas malignant? A population study. Neurology. 2002;59(6):947–949. - PubMed
    1. Heiss WD, Raab P, Lanfermann H. Multimodality assessment of brain tumors and tumor recurrence. J Nucl Med. 2011;52(10):1585–1600. - PubMed
    1. Morita N, Harada M, Otsuka H, Melhem ER, Nishitani H. Clinical application of MR spectroscopy and imaging of brain tumor. Magn Reson Med Sci. 2010;9(4):167–175. - PubMed

Publication types