

Meteorological influences on the seasonality of Lyme disease in the United States
- PMID: 24470565
- PMCID: PMC3945695
- DOI: 10.4269/ajtmh.13-0180
Meteorological influences on the seasonality of Lyme disease in the United States
Abstract
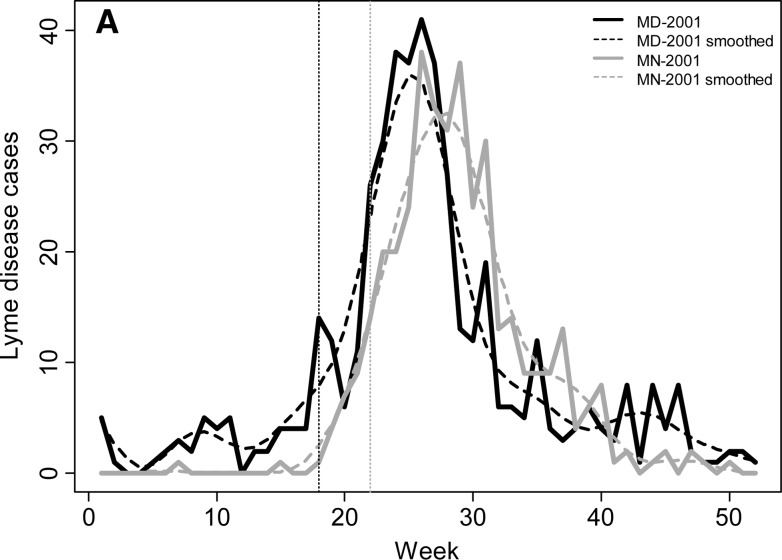
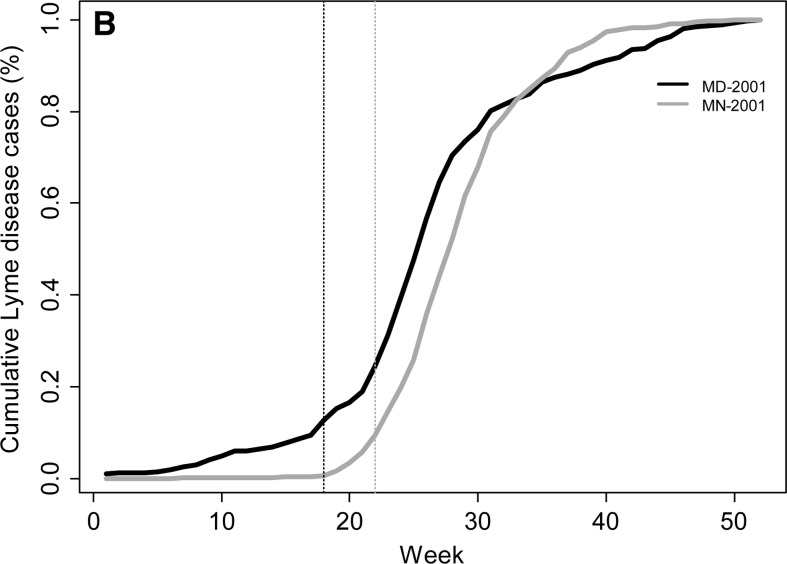
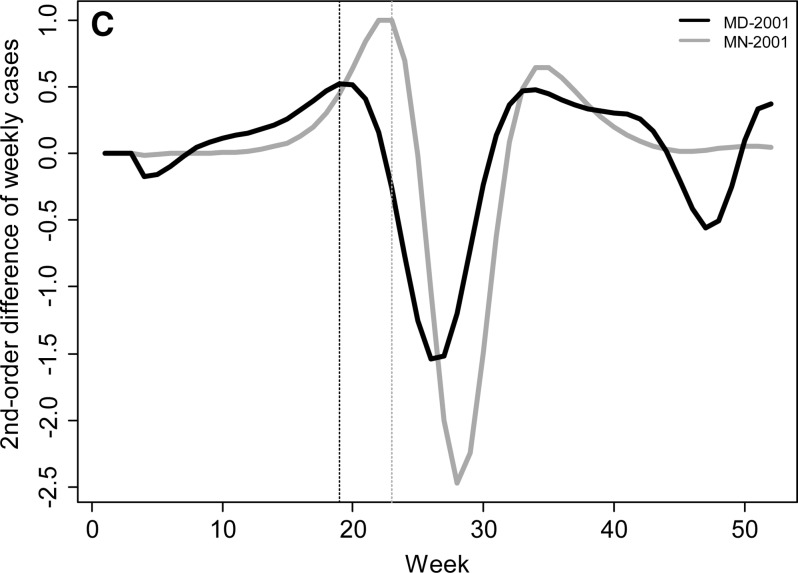
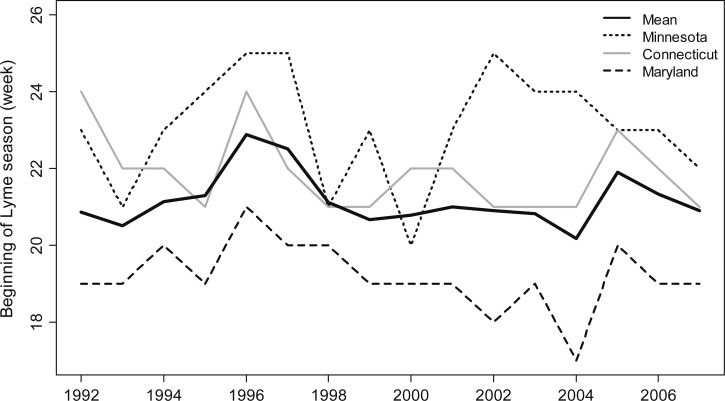
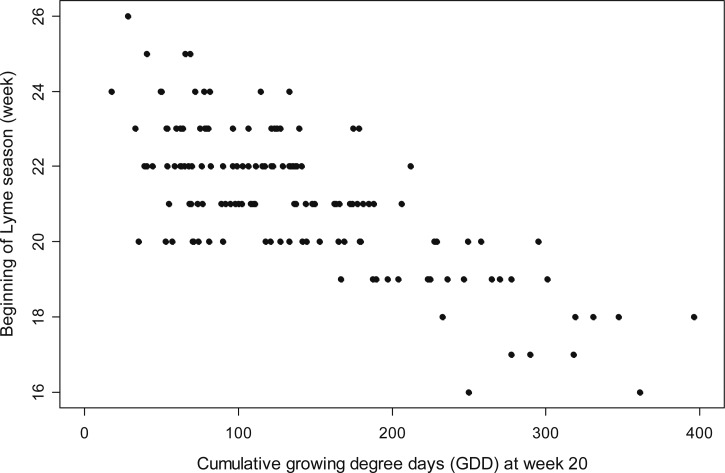
Lyme disease (Borrelia burgdorferi infection) is the most common vector-transmitted disease in the United States. The majority of human Lyme disease (LD) cases occur in the summer months, but the timing of the peak occurrence varies geographically and from year to year. We calculated the beginning, peak, end, and duration of the main LD season in 12 highly endemic states from 1992 to 2007 and then examined the association between the timing of these seasonal variables and several meteorological variables. An earlier beginning to the LD season was positively associated with higher cumulative growing degree days through Week 20, lower cumulative precipitation, a lower saturation deficit, and proximity to the Atlantic coast. The timing of the peak and duration of the LD season were also associated with cumulative growing degree days, saturation deficit, and cumulative precipitation, but no meteorological predictors adequately explained the timing of the end of the LD season.
Conflict of interest statement
Disclosure: The NLDAS-2 primary forcing data used in this study were acquired as part of the mission of NASA's Earth Science Division and archived and distributed by the Goddard Earth Sciences (GES) Data and Information Services Center (DISC).
Figures
References
-
- Johnson RC, Schmid GP, Hyde FW, Steigerwalt AG, Brenner DJ. Borrelia burgdorferi sp. nov.: etiological agent of Lyme disease. Int J Syst Bacteriol. 1984;34:496–497.
-
- Steere AC, Malawista SE, Snydman DR, Shope RE, Andiman WA, Ross MR, Steele FM. Lyme arthritis: an epidemic of oligoarticular arthritis in children and adults in three Connecticut communities. Arthritis Rheum. 1977;20:7–17. - PubMed
-
- Bacon RM, Kugeler KJ, Mead PS. Surveillance for Lyme disease–United States, 1992–2006. MMWR Surveill Summ. 2008;57:1–9. - PubMed
-
- Fish D. Population ecology of Ixodes dammini. In: Ginsberg HS, editor. Ecology and Environmental Management of Lyme disease. New Brunswick, NJ: Rutgers University Press; 1993. pp. 25–42.
-
- Barbour AG, Fish D. The biological and social phenomenon of Lyme-disease. Science. 1993;260:1610–1616. - PubMed
Publication types
MeSH terms
LinkOut - more resources
Full Text Sources
Other Literature Sources
Medical
Research Materials
