. 2014 Jan 1;37(1):199-208.
doi: 10.5665/sleep.3338.

Envelope analysis of the airflow signal to improve polysomnographic assessment of sleep disordered breathing

Affiliations

Envelope analysis of the airflow signal to improve polysomnographic assessment of sleep disordered breathing

Javier A Díaz et al. Sleep. .

Abstract

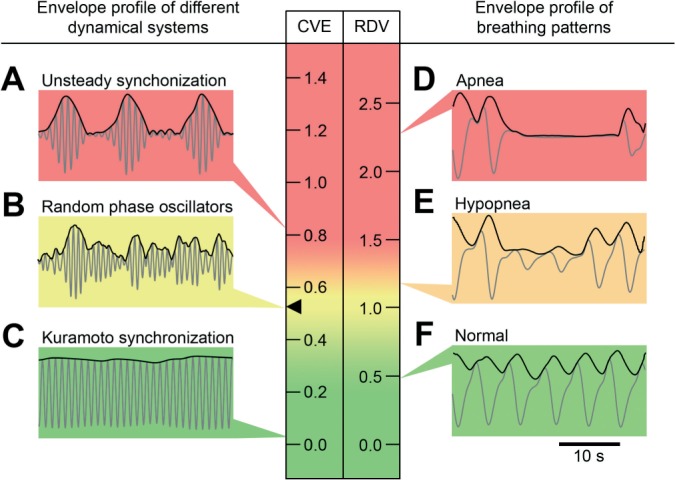
Study objectives: Given the detailed respiratory waveform signal provided by the nasal cannula in polysomnographic (PSG) studies, to quantify sleep breathing disturbances by extracting a continuous variable based on the coefficient of variation of the envelope of that signal.

Design: Application of an algorithm for envelope analysis to standard nasal cannula signal from actual polysomnographic studies.

Setting: PSG recordings from a sleep disorders center were analyzed by an algorithm developed on the Igor scientific data analysis software.

Patients or participants: Recordings representative of different degrees of sleep disordered breathing (SDB) severity or illustrative of the covariation between breathing and particularly relevant factors and variables.

Interventions: The method calculated the coefficient of variation of the envelope for each 30-second epoch. The normalized version of that coefficient was defined as the respiratory disturbance variable (RDV). The method outcome was the all-night set of RDV values represented as a time series.

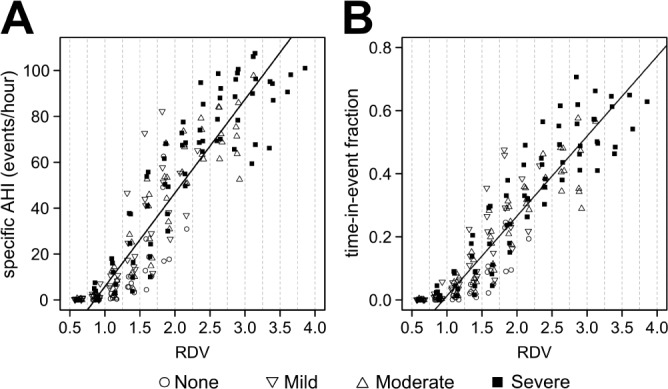
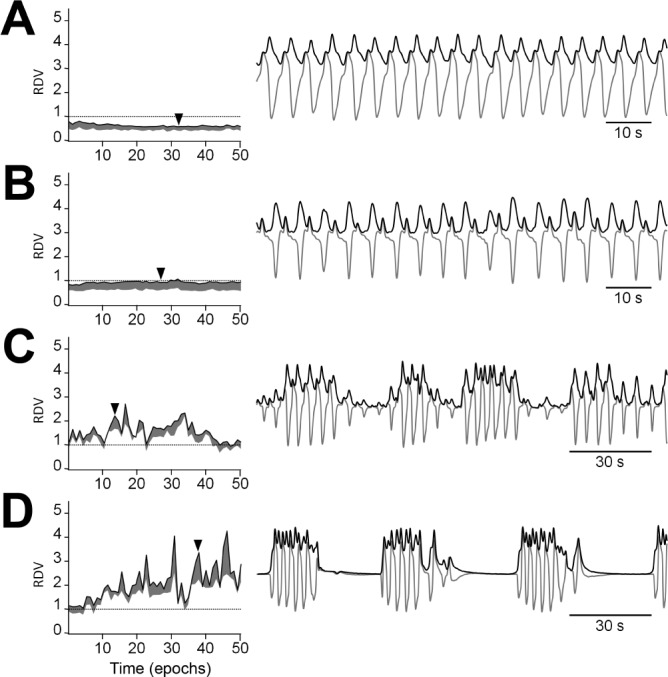
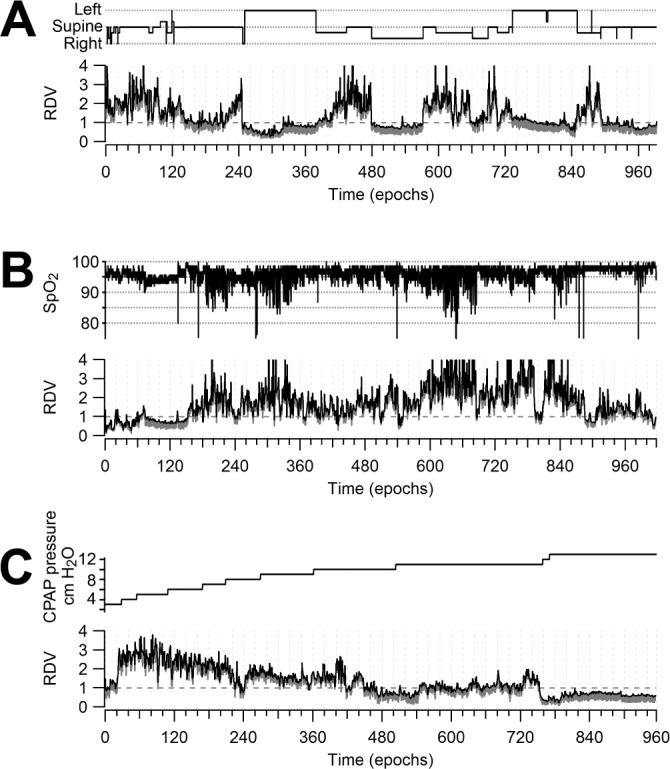
Measurements and results: RDV quantitatively reflected departure from normal sinusoidal breathing at each epoch, providing an intensity scale for disordered breathing. RDV dynamics configured itself in recognizable patterns for the airflow limitation (e.g., in UARS) and the apnea/hypopnea regimes. RDV reliably highlighted clinically meaningful associations with staging, body position, oximetry, or CPAP titration.

Conclusions: Respiratory disturbance variable can assess sleep breathing disturbances as a gradual phenomenon while providing a comprehensible and detailed representation of its dynamics. It may thus improve clinical diagnosis and provide a revealing descriptive tool for mechanistic sleep disordered breathing modeling. Respiratory disturbance variable may contribute to attaining simplified screening methodologies, novel diagnostic criteria, and insightful research tools.

Keywords: Signal envelope analysis; medical informatics applications; nasal cannula / pressure; polysomnography; sleep apnea syndromes; transducer; upper airway resistance sleep apnea syndrome.


Figures

Figure 1
Figure 1
Signal analysis based on the coefficient of variation of the envelope (CVE). Signals are presented as gray traces and envelopes as black traces. Scales for the CVE and the respiratory disturbance variable (RDV = CVE/0.523) are color coded in a rising gradient from green to yellow to red. The value 0.523 (black arrowhead) corresponds to the coefficient of variation of the Rayleigh distribution. Insets on the left: signals and envelopes generated by different dynamical system models: (A) Unsteady synchronization, one of the complex dynamic system behaviors reported by Matthews et al. (B) Random phase oscillators. (C) Synchronous behavior of the Kuramoto model with an overcritical coupling constant. Insets on the right: 30-second representative segments of the airflow signal and its envelopes. (D) Apnea. (E) Hypopnea. (F) Normal breathing. Each inset points to the CVE or RDV value of the signal envelope in the scale.
Figure 2
Figure 2
Characterization of breathing signal morphology by RDV. Representative examples of respiratory airflow recording are displayed as gray traces. The signal envelope is graphed as a black trace, boxed in a central 30-second window. The actual calculated RDV for each envelope is indicated on the right. Each panel is labeled as “no-event,” “hypopnea,” or “apnea,” according to how it would have been scored following AASM criteria. Cases are ranked by their RDV. (A-F) Respiratory patterns that would have not been considered as respiratory events. Note that D, despite its regularity, exhibits a characteristic airflow limitation pattern that yields a relatively high RDV. (G-O) Respiratory patterns related to hypopneas and apneas of increasing severity.
Figure 3
Figure 3
Scatter plots illustrate the relationship (A) between RDV and specific AHI and (B) between RDV and time-in-event fraction. Dashed lines delimit segments of a given RDV category, as explained in Methods. Each data point in (A) represents the specific AHI value obtained from the cumulated time that each of the 24 subjects spent in a given RDV category. The same occurs in (B) for variable time-in-event fraction. Symbols indicate the OSA case severity, based on the all-night AHI score of the case. Cases with none or mild OSA do not contribute with data points to the higher RDV categories. Almost all respiratory events occur with RDV > 1.0. Simple linear regressions were estimated and the fitted lines were displayed. In these calculations, only RDV > 1.0 were considered.
Figure 4
Figure 4
RDV time courses for representative examples of major SDB respiratory regimes. The left side graphs show 25-min spans of RDV and their spread. The right side graphs illustrate the airflow signal and its envelope for a short fragment whose temporal position is indicated by an arrowhead. (A) Normal breathing shows low RDVs, well below 1, with a narrow spread. (B) A sustained airflow limitation pattern shows a steady RDV around 1 with a wider spread. (C) A hypopnea-rich regime shows a jagged RDV curve approximately fluctuating between 1 and 2. (D) An apnea-rich regime shows sharp RDV peaks far above 2.
Figure 5
Figure 5
RDV in the context of polysomnographic analysis. How the informative power of RDV enhances polysomnographic analysis is exemplified by one control case and three representative cases of SDB of increasing severity. Each panel shows the all-night RDV time course in the same time axis of an EEG spectrogram and its corresponding hypnogram. The insets on the right show the distribution of RDV for the whole study. Note that the more severe the case, the more right-shifted the RDV distribution. Bottom insets show airflow fragments whose temporal positions and corresponding RDV values are indicated by dashed lines. (A) Control case (AHI = 0.3) exhibiting normal sleep architecture and normal breathing. (B) UARS case (AHI = 3.6) with segments of flattened contour airflow profile. Three different respiratory regimes are highlighted: breathing in wakefulness, a sustained airflow limitation pattern, and transient airflow limitations associated to arousals. The upper inset is a segment of EEG featuring CAP activity, a marker of the electrocortical instability of UARS. (C) A state-dependent OSA case (AHI = 38.7) where apneas relate specifically to REM sleep. (D) A severe OSA case (AHI = 72.3) with long-lasting apneas.
Figure 6
Figure 6
Relation of RDV to relevant polysomnographic variables. (A) RDV provides a global appraisal of the correlation between breathing disturbance and body position, with high values detected while the patient is in a supine position. (B) RDV confirms the respiratory origin of oxygen desaturation by remarkably mirroring the oximetry. (C) RDV allows an effective monitoring of breathing improvement during a CPAP titration with pressures going from 3 to 13 cm H2O.
Figure 7
Figure 7
RDV invariance to amplitude scaling. The three curves displayed are RDV, the root mean square (RMS) amplitude of the airflow signal and oximetry. At epoch 370 there is a marked airflow signal change, a common instrumental problem in polysomnography. This change is not reflected in the oximetry, suggesting its artifactual origin. Note that RDV remains unaffected by these signal variations, whereas actual airflow disruption, occurring within the epoch and caused by apneas and hypopneas, do co-vary with RDV as they do with oximetry.

References

    1. Duran J, Esnaola S, Rubio R, Iztueta A. Obstructive sleep apnea-hypopnea and related clinical features in a population-based sample of subjects aged 30 to 70 yr. Am J Respir Crit Care Med. 2001;163(3 Pt 1):685–9. - PubMed
    1. George CF. Sleep apnea, alertness, and motor vehicle crashes. Am J Respir Crit Care Med. 2007;176:954–6. - PubMed
    1. Lee W, Nagubadi S, Kryger MH, Mokhlesi B. Epidemiology of obstructive sleep apnea: a population-based perspective. Expert Rev Respir Med. 2008;2:349–64. - PMC - PubMed
    1. Nieto FJ, Young TB, Lind BK, et al. Association of sleep-disordered breathing, sleep apnea, and hypertension in a large community-based study. Sleep Heart Health Study. JAMA. 2000;283:1829–36. - PubMed
    1. Peppard PE, Szklo-Coxe M, Hla KM, Young T. Longitudinal association of sleep-related breathing disorder and depression. Arch Intern Med. 2006;166:1709–15. - PubMed

Publication types