Review
. 2014:32:283-321.
doi: 10.1146/annurev-immunol-032712-100024. Epub 2014 Jan 22.

Transcriptional control of early T and B cell developmental choices

Affiliations
Review

Transcriptional control of early T and B cell developmental choices

Ellen V Rothenberg. Annu Rev Immunol. 2014.

Abstract

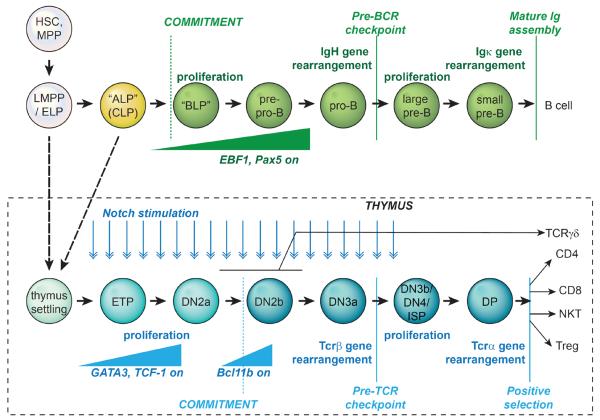
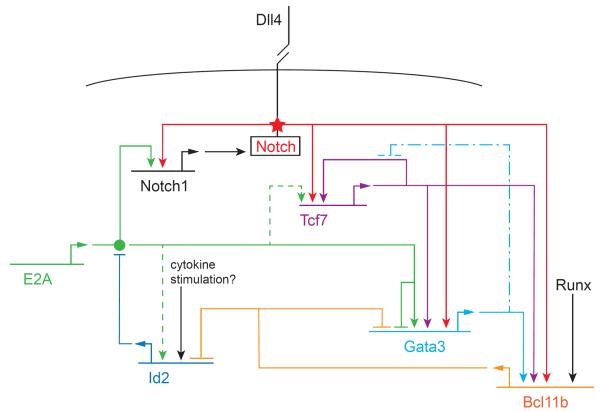
T and B cells share a common somatic gene rearrangement mechanism for assembling the genes that code for their antigen receptors; they also have developmental pathways with many parallels. Shared usage of basic helix-loop-helix E proteins as transcriptional drivers underlies these common features. However, the transcription factor networks in which these E proteins are embedded are different both in membership and in architecture for T and B cell gene regulatory programs. These differences permit lineage commitment decisions to be made in different hierarchical orders. Furthermore, in contrast to B cell gene networks, the T cell gene network architecture for effector differentiation is sufficiently modular so that E protein inputs can be removed. Complete T cell-like effector differentiation can proceed without T cell receptor rearrangement or selection when E proteins are neutralized, yielding natural killer and other innate lymphoid cells.


Figures

FIGURE 1
FIGURE 1
Schematic of major stages of B and T cell development. Consult Table 1 for definition of stage phenotypes. The figure introduces key stages and emphasizes the parallelism between B cell development stages and αβ T lineage cell stages in terms of immunoreceptor gene rearrangement timing, proliferative bursts and major developmental checkpoints. Specific regulatory genes important for lineage specification are turned on during the intervals shown. Stages are defined by ability to discriminate phenotypes and do not represent uniform lengths of time or numbers of cell cycles. Note that the T cell program unlike the B cell program generates at least five distinct types of T cells within the thymus (in fact the TCRγδ cells are further subdivided, not shown). “Thymus settling” = thymus settling precursors, which are thought to be derived from “ALP” type common lymphoid precursors and/or from certain LMPP or other ELP type cells in vivo. All of these, and even myeloid specified cells, can respond when introduced into the thymus by developing into T cells.
FIGURE 2
FIGURE 2
Major alternative fate branchpoints for B and T cell precursors. The figure explains the timing of commitment, by showing the demonstrated alternative fates that can still be adopted by B and T-cell precursors until the latest stages shown. Heavy line arrows: major pathways. Light solid line arrows: strong pathways, high precursor frequencies for the indicated fate alternative. Light dashed line arrows: variant pathways, not a default in vivo but readily demonstrable at high frequency under experimental conditions. Dotted line arrows: measurable experimentally but distinctly reduced precursor frequency for the indicated path at this stage as compared to immediate precursor. Mac, DC: macrophage and dendritic cells. In addition, granulocyte fates are also accessible to pre-commitment early T cells. For simplicity, within the T-cell lineage, fates that are still robustly accessible at the DN2a stage are not also shown for the antecedent thymus settling and ETP stages. BLP and DN2b cells are largely if not completely committed.
FIGURE 3
FIGURE 3
Partial gene regulatory network for early T-cell specification. Horizontal lines: genes coding for regulatory factors. Bent arrows: transcription and translation of gene leading to product (itself a regulatory factor). Genes and their products have the same color code. Arrows: positive regulatory effects of factors on indicated genes. Blocked-end lines: negative regulatory effects of factors on indicated genes. Filled circle: ability of E2A to form a functionally active dimer: this assembly is blocked by Id2. Star: activation of Notch transmembrane protein by binding to its ligand Delta-like 4 (DLL4) on a neighboring cell; the effect is to cleave the Notch intracellular domain and allow it to be transported to the nucleus where it functions as a transcriptional coactivator on the indicated target genes. Note that none of these regulators acts in a strictly all-or-nothing way. Although many genes require Notch input for activation, those shown here do not require its continuation for maintenance of of expression. The repressors indicated here modulate rather than silence the indicated target genes. Solid lines: relationships with strong molecular and functional support within the context of T-lineage specification. Dashed lines: relationships seen in related cells but not directly demonstrated in DN T-cell precursors. Long dash-dot lines: inferred effect of GATA-3 on Tcf7 when GATA-3 is overexpressed. Details and sources are given in the text.
FIGURE 4
FIGURE 4
Key regulatory targets for program maintenance and alternative program exclusion in development of T, B, and innate lymphocytes. The framework is a simplified version of Fig. 2. Green: stages of B-cell development in which EBF1 and Pax5 expression is dominant; i.e. the EBF1 and Pax5 “territory”. Light blue: stages of T-cell development in which GATA-3 and TCF-1 are dominant, i.e. the GATA3 and TCF-1 “territory”. Violet: Id2 “territory” of programs that generate innate cells. Note that the influence of Notch signaling (dark blue frame) does not extend throughout T-cell development but does extend to some ILCs. GATA-3 and TCF-1 also help generating certain ILCs, including a major type of NK cells. The figure depicts the selective cross-repression between the components of B and T-cell programs that uniquely distinguish them from each other. In contrast, E proteins including E2A are components of both.

References

    1. Bajoghli B, Aghaallaei N, Hess I, Rode I, Netuschil N, Tay BH, Venkatesh B, Yu JK, Kaltenbach SL, Holland ND, Diekhoff D, Happe C, Schorpp M, Boehm T. Evolution of genetic networks underlying the emergence of thymopoiesis in vertebrates. Cell. 2009;138:186–97. - PubMed
    1. Ramirez J, Lukin K, Hagman J. From hematopoietic progenitors to B cells: mechanisms of lineage restriction and commitment. Curr.Opin.Immunol. 2010;22:177–84. - PMC - PubMed
    1. Zandi S, Bryder D, Sigvardsson M. Load and lock: the molecular mechanisms of B-lymphocyte commitment. Immunol Rev. 2010;238:47–62. - PubMed
    1. Mandel EM, Grosschedl R. Transcription control of early B cell differentiation. Curr.Opin.Immunol. 2010;22:161–7. - PubMed
    1. Cobaleda C, Schebesta A, Delogu A, Busslinger M. Pax5: the guardian of B cell identity and function. Nat.Immunol. 2007;8:463–70. - PubMed

Publication types

MeSH terms

Substances

LinkOut - more resources