. 2014 Jul;51(1):43-55.
doi: 10.1165/rcmb.2013-0284OC.

Tissue optical clearing, three-dimensional imaging, and computer morphometry in whole mouse lungs and human airways

Affiliations

Tissue optical clearing, three-dimensional imaging, and computer morphometry in whole mouse lungs and human airways

Gregory D Scott et al. Am J Respir Cell Mol Biol. 2014 Jul.

Abstract

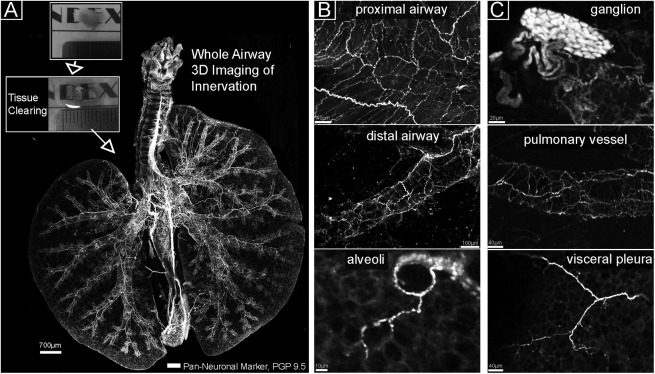
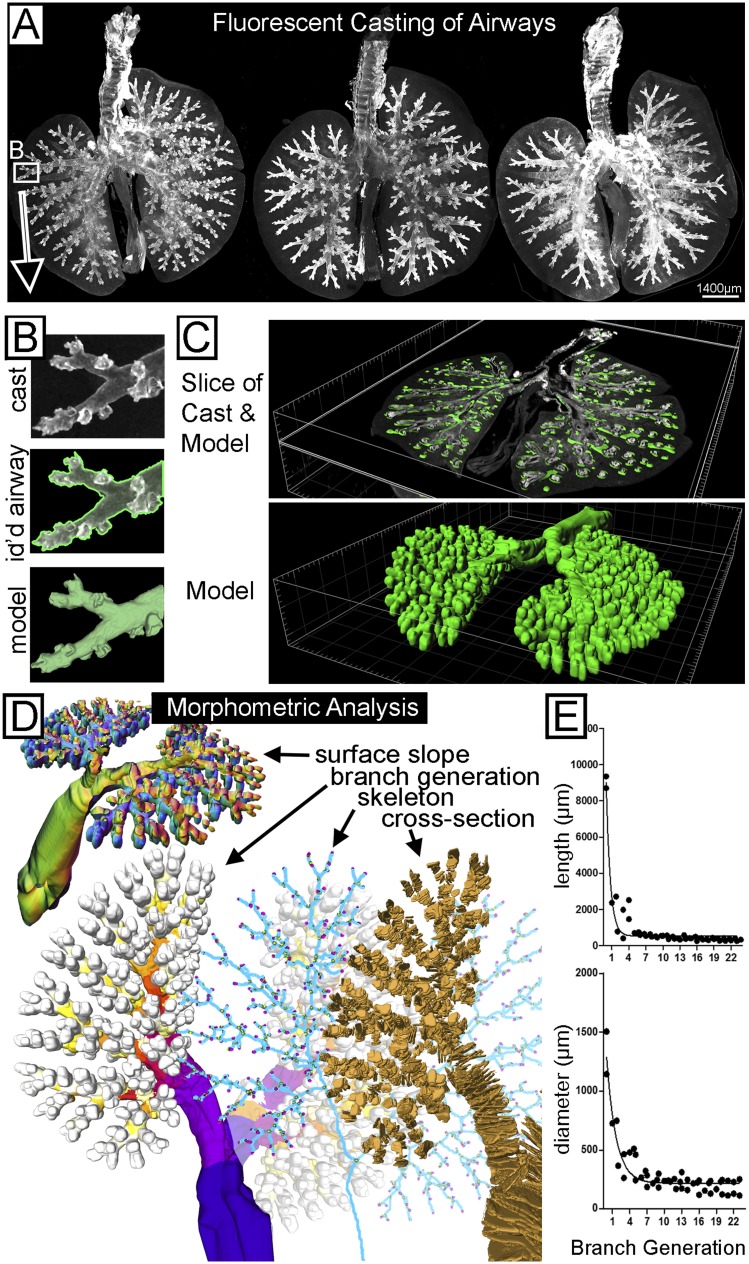
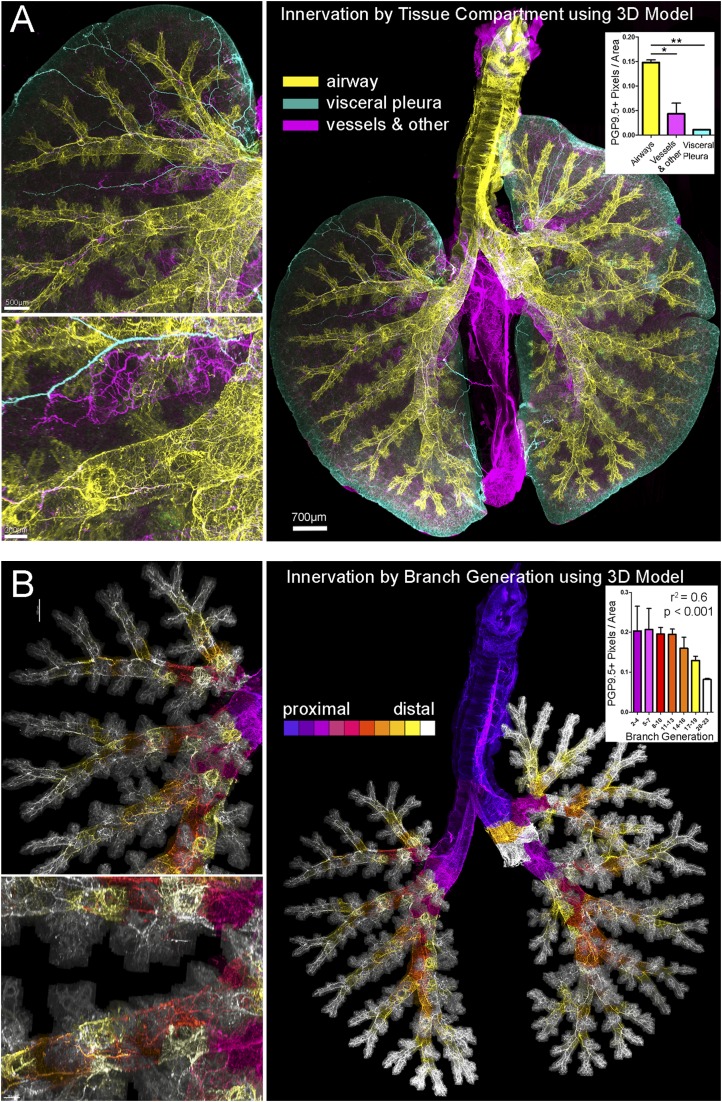
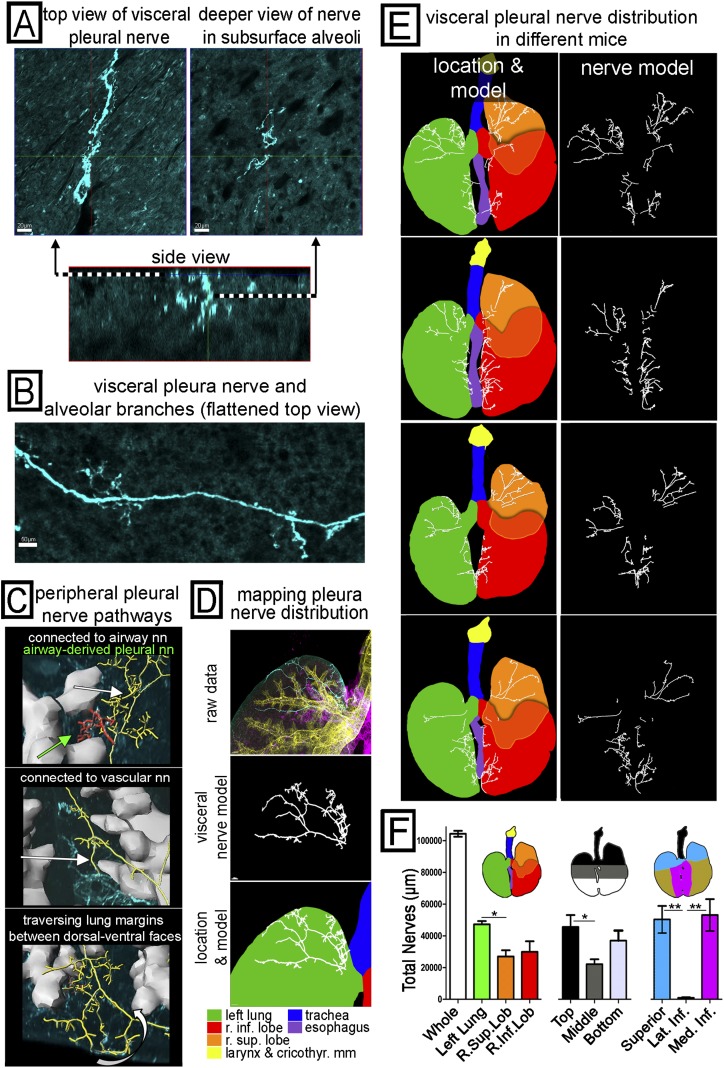
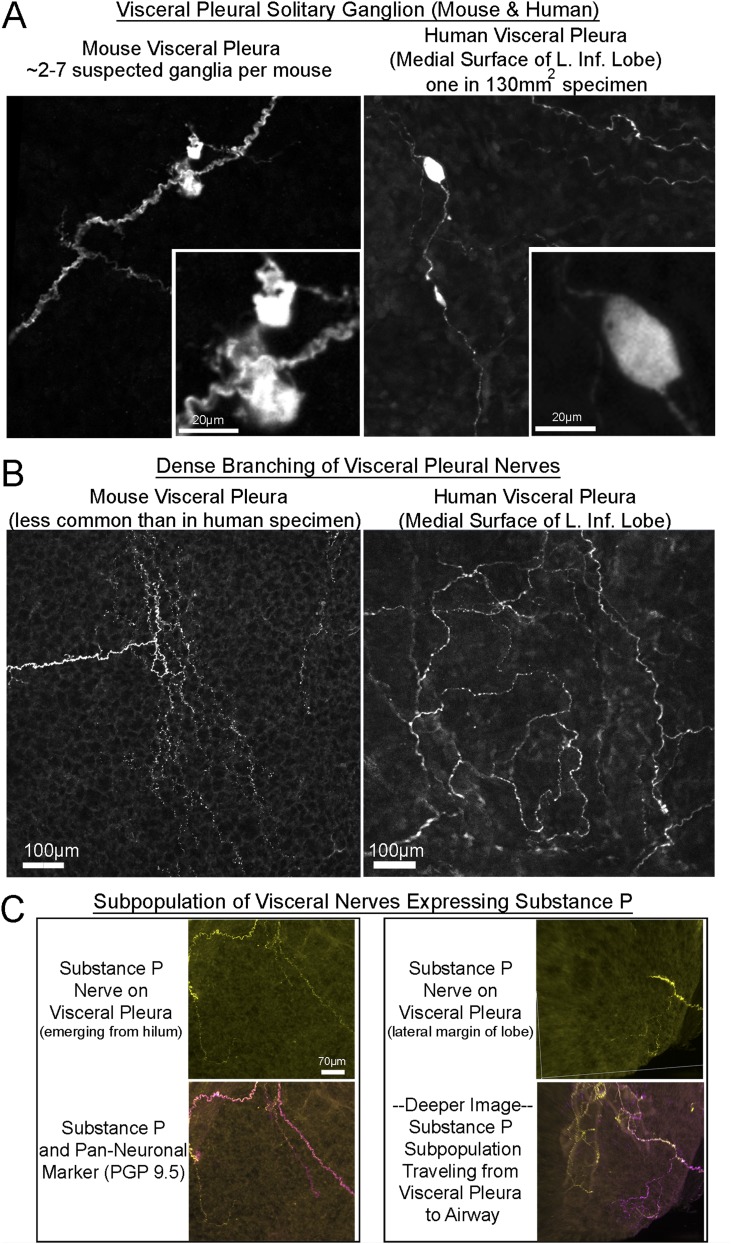
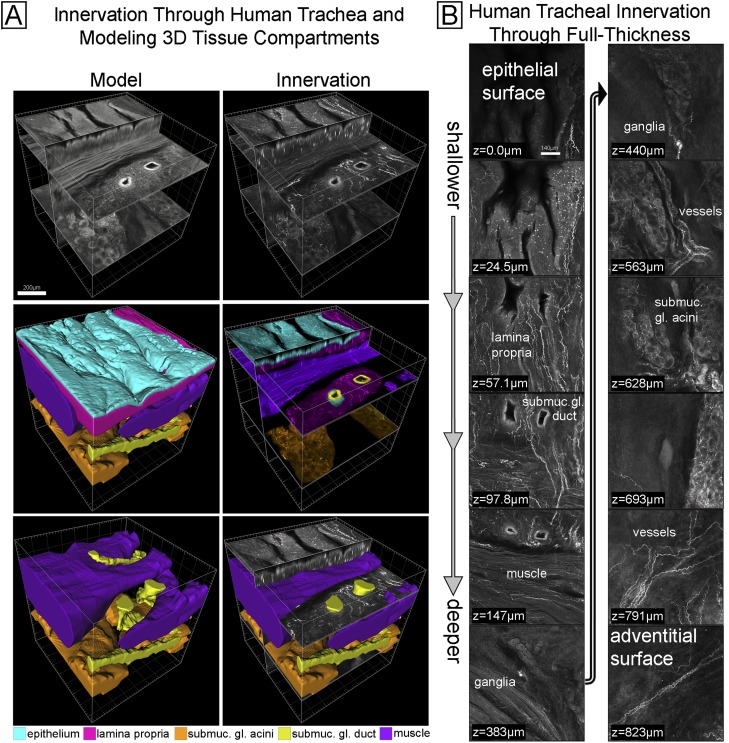
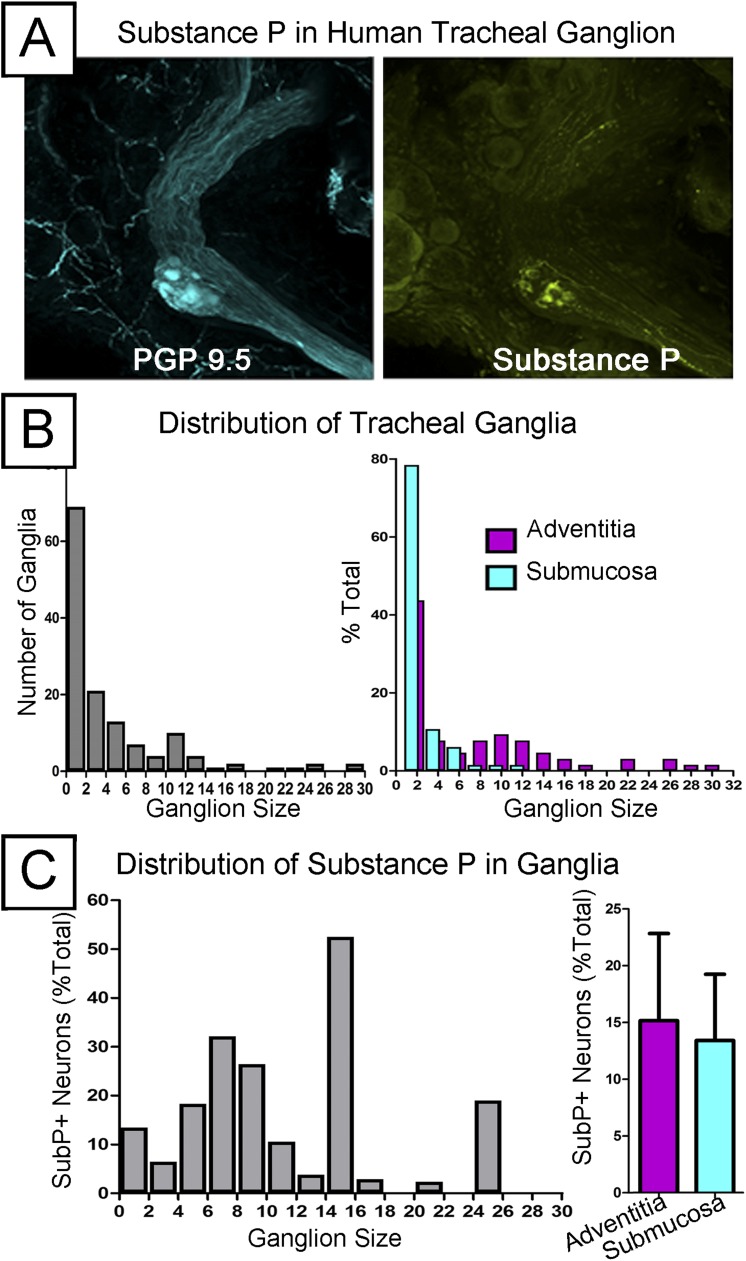
In whole adult mouse lung, full identification of airway nerves (or other cellular/subcellular objects) has not been possible due to patchy distribution and micron-scale size. Here we describe a method using tissue clearing to acquire the first complete image of three-dimensional (3D) innervation in the lung. We then created a method to pair analysis of nerve (or any other colabeled epitope) images with identification of 3D tissue compartments and airway morphometry by using fluorescent casting and morphometry software (which we designed and are making available as open-source). We then tested our method to quantify a sparse heterogeneous nerve population by examining visceral pleural nerves. Finally, we demonstrate the utility of our method in human tissue to image full thickness innervation in irregular 3D tissue compartments and to quantify sparse objects (intrinsic airway ganglia). Overall, this method can uniquely pair the advantages of whole tissue imaging and cellular/subcellular fluorescence microscopy.

Keywords: clearing; modeling; morphometry; nerve; visceral pleura.


Figures

Figure 1.
Figure 1.
Tissue clearing and whole airway imaging of nerves. (A) Flattened image of a whole mouse lung. Visible are all nerves stained with the pan-neuronal marker PGP 9.5 (white). The airway is oriented with the left lung on the left and superior/inferior right lung lobes on the right. The boxed areas show a murine lung lobe before (top) and after (bottom) optical clearing. (B, C) Magnified images from A show nerve populations in areas of the lung and a ganglion in the carina region.
Figure 2.
Figure 2.
Fluorescent casting and computer modeling of mouse airways. (A) Flattened images of three different representative mouse lungs. Airways were labeled with fluorophore-conjugated streptavidin, creating a fluorescent cast of the airways. (B) A magnified view (top) of distal airway cast from A. The computer identification of the airway wall (transparent green) is overlaid on the cast image (middle), and the resulting computer model tessellated from computer identification (bottom). (C) Oblique image slices (top) through a whole casted airway and overlaid three-dimensional (3D) model and (bottom) the whole 3D model. (D) Visual representations of local and global values calculated by our software from the airway model to automate morphometric analysis. The direction of local airway surface slope for analysis of shape and location was color coded by the computer and shown (upper left) in an oblique view of a coronal-cut airway model. Branch generation was color coded by the computer proximally to distally from blue to red to white (lower left). Airway generation figures and videos also show the two cut stems of the post-caval and middle lobes (marked white), which were removed before imaging. The skeletonized representation (blue, bottom middle) of the airway model made with Liu “skeleton” software was used for identification of branch-points (yellow) and end-points (pink). For calculating diameter, the computer made cross sections of the airway that look like successive disc shapes (lower right, gold). Every third cross section is shown for viewing purposes. (E) For demonstration purposes (n = 2), diameter and length were quantified over branch generations (a nonlinear decay fit is included).
Figure 3.
Figure 3.
Combining 3D casting (as in Figure 2), computer modeling, and morphometric analysis with images of whole airway innervation. (A) Nerve images were color coded based on tissue compartment: airways are yellow; visceral pleural are cyan and vessel/other are magenta. The left superior lung is shown at increasing magnification (upper left, lower left) to demonstrate airway (yellow) and vascular (magenta) nerves running parallel to each other and visceral pleural nerves along the surface (cyan). The corresponding whole airway view (right) of innervation colored by tissue compartment (n = 2) was used to calculate nerve density in airway generations. *P < 0.05; **P < 0.01. (B) Nerve images were color coded based on airway generation identified in the cast 3D model from proximal (blue) to distal (white), and the density of nerves in each generation was calculated (inset). The Pearson’s correlation analysis is shown above the graphed data and was r2 = −0.7478 (P < 0.0001). The left superior lung is shown at the same magnified views (left) as in A to demonstrate density of nerves supplying distal airway generations. Airway generation figures and videos also show the two cut stems of the post-caval and middle lobes (white), which were removed before imaging. See Video E3 for innervation color coded by branch generation.
Figure 4.
Figure 4.
Mapping the pathways of peripheral, visceral pleural nerves and quantifying their overall distribution. (A) A 3D image sample of a visceral pleura nerve is shown in a top-down view of the pleural surface (upper left), a top-down view deeper in alveoli (upper right), and a side view of the same nerve (lower) oriented with the pleural surface on top. (B) A wider field of the pleural surface is shown in a flattened projection to demonstrate a visceral pleural nerve with branches (these usually penetrate alveoli). (C) Some of the novel peripheral pathways taken by visceral nerves are shown with airways (gray) and visceral nerves that have been identified and modeled (yellow, red). Visceral nerves are seen connecting to airway innervation (top, white arrow), connecting to vascular innervation (middle, white arrow), and traversing the lung margins (bottom, white arrow) connecting dorsal and ventral visceral nerve networks. We also found rare patches of visceral nerves (top, green arrow) derived from airway innervation but not connected to the main visceral nerve network. (DF) Identification, modeling, and mapping of visceral nerve distribution across the whole airway. (D) Views of the superior left lung visceral pleural nerves in cyan from Figure 3A (top), the identified visceral pleural nerves (middle), and visceral pleural nerves overlaid on a lung diagram color coded by region (bottom). The color legend is shown. (E) Visceral pleural nerves shown with (left) and without (right) the color-coded lung diagram showing different regions in four different mouse lungs. (F) Aggregate nerve length based on three different schemes to subdivide the airways (lobe, top to bottom, and superior versus medial inferior versus lateral inferior) was quantified by the computer (n = 4). *P < 0.05; **P < 0.01. Visceral nerve pathways are shown in Videos E4–E6.
Figure 5.
Figure 5.
Identifying new nerves on visceral pleural surface in mouse and human. (A, B) Images of nerves found in mouse lungs and the medial surface of the human left inferior lobe. (A) images showing novel visceral pleura ganglia stained for PGP 9.5 in mouse (left) and human (right) (see mouse ganglia in Video E4). (B) Areas of dense nerve branching are shown in mouse (left) and human (right) visceral pleura. (C) A subpopulation of visceral pleural nerves in mouse tissue that express substance P.
Figure 6.
Figure 6.
Imaging innervation and modeling tissue compartments through full-thickness human trachea. (A) A full-thickness 3D image of innervation (upper right) and colored modeled tissue compartments (lower four images) made from red emission autofluorescence (upper left). The middle left and lower left images show the computer model of each tissue compartment. The right middle image shows the nerve image separated (by color) into distinct tissue compartments using the computer model. A color legend for the tissue compartments is included. (B) Select images of the data from A are shown from epithelium (top left) to the adventitia (bottom right). The presence of innervation in tissue compartments is labeled (e.g., lamina propria). See Video E7.
Figure 7.
Figure 7.
Quantifying the distribution of human tracheal ganglia and the substance P subpopulation (n = 6). (A, left) Mid-sized intrinsic ganglia in human trachea stained with PGP 9.5. (A, right) Substance P was also labeled in these ganglia, where it stains neuron bodies and axons within the neighboring nerve bundle. (B, left) The relative abundance of different sized ganglia across the whole trachea and (right) their relative abundance when separated into submucosa and adventitia layers. (C) Quantification of the size distribution and overall layer separation in the substance P subpopulation.

References

    1. Muhlfeld C, Graulich T, Das SK, Krasteva G, Wessels L, Ruppert C, Kummer W, Hofler G.Tracheal innervation and alveolar epithelial type II cell lamellar bodies are reduced in the cancer cachectic mouse Am J Respir Crit Care Med 2012. [accessed 2013 Oct 1]. Available from: http://www.atsjournals.org/doi/abs/10.1164/ajrccm-conference.2012.185.1_... - DOI
    1. O’Connell F, Springall DR, Moradoghli-Haftvani A, Krausz T, Price D, Fuller RW, Polak JM, Pride NB. Abnormal intraepithelial airway nerves in persistent unexplained cough? Am J Respir Crit Care Med. 1995;152:2068–2075. - PubMed
    1. Scott GD, Fryer AD. Role of parasympathetic nerves and muscarinic receptors in allergy and asthma. Chem Immunol Allergy. 2012;98:48–69. - PMC - PubMed
    1. Ollerenshaw SL, Jarvis D, Sullivan CE, Woolcock AJ. Substance P immunoreactive nerves in airways from asthmatics and nonasthmatics. Eur Respir J. 1991;4:673–682. - PubMed
    1. Howarth PH, Springall DR, Redington AE, Djukanovic R, Holgate ST, Polak JM. Neuropeptide-containing nerves in endobronchial biopsies from asthmatic and nonasthmatic subjects. Am J Respir Cell Mol Biol. 1995;13:288–296. - PubMed

Publication types